DRAGON_MANVELCROIX


Location

lon / lat [deg]: -95.3925 / 29.5204

Source network: AERONET


Geostationary surface albedo (GSA) data


“+000”


“+057/+063”


Landcover information (based on ESA CCI landcover data)


Landcover fractions @ 2km distance


Landcover fractions @ 20 km distance


Legend


Distance to open water bodies [km]:

1.62

Distance to urban areas [km]:

1.3


Radius: 1 km

Number of landcover classes:

1

Dominant landcover type:

130: grassland

Fraction of dominant landcover type [%]:

100.0


Radius: 2 km

Number of landcover classes:

6

Dominant landcover type:

130: grassland

Fraction of dominant landcover type [%]:

78.0


Radius: 5 km

Number of landcover classes:

5

Dominant landcover type:

130: grassland

Fraction of dominant landcover type [%]:

70.0


Radius: 10 km

Number of landcover classes:

4

Dominant landcover type:

130: grassland

Fraction of dominant landcover type [%]:

71.0


Radius: 20 km

Number of landcover classes:

5

Dominant landcover type:

130: grassland

Fraction of dominant landcover type [%]:

53.0


Disturbances


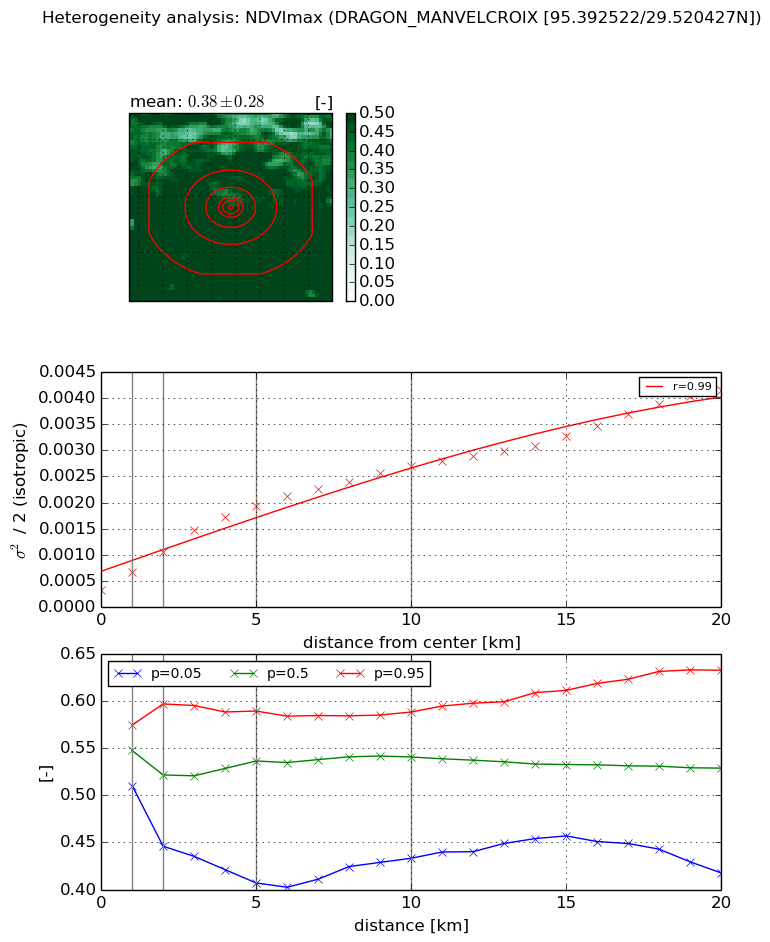
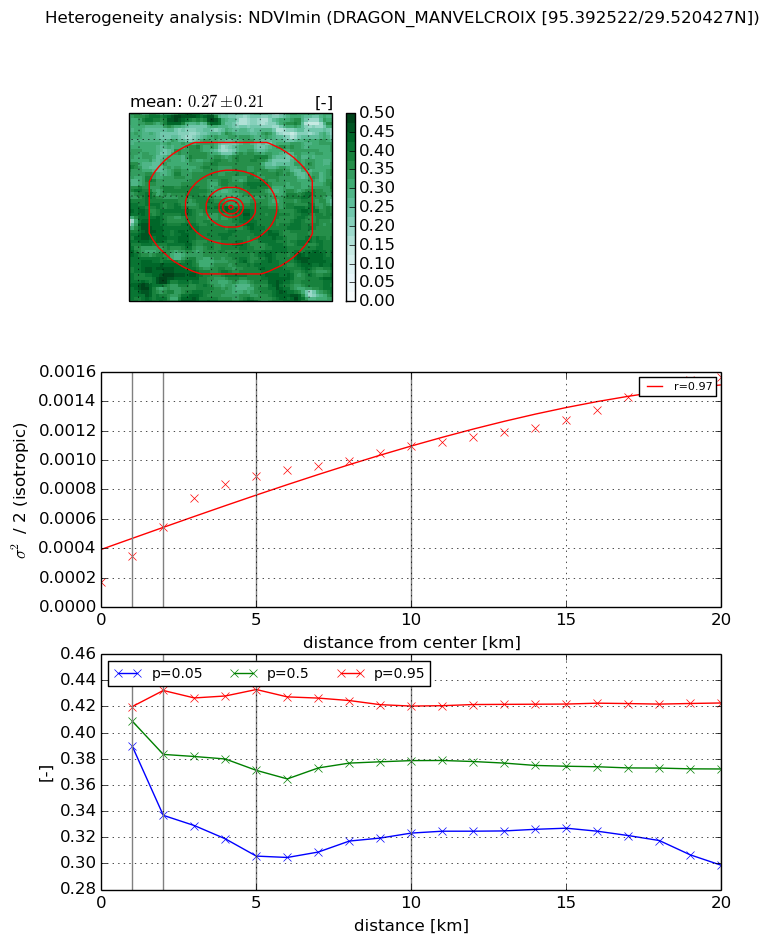
Heterogeneity analysis

The heterogeneity analysis provides information about the spatial and temporal heterogeneity of the site.

Topography


Roman et al. (2009) index


St

2.6258818377

Rcv

0.102799500248

Rse

0.0

Rst

-0.0639315143372

Rsv

0.975742327865


Height range @ 1km [m]

6

Height range @ 2km [m]

6

Height range @ 5km [m]

6

Height range @ 10km [m]

-999

Height range @ 20km [m]

-999


Variance slope @ 1 km

1

Variance slope @ 2 km

0

Variance slope @ 5 km

0

Variance slope @ 10 km

-999

Variance slope @ 20 km

-999


NDVI (max. NDVI composite)


Roman et al. (2009) index


St

1.5592063239

Rcv

0.128281804344

Rse

0.0

Rst

-0.287881563619

Rsv

1.50789245071


NDVI range @ 1km [-]

0.06

NDVI range @ 2km [-]

0.15

NDVI range @ 5km [-]

0.18

NDVI range @ 10km [-]

0.16

NDVI range @ 20km [-]

0.22


Variance slope @ 1 km

0.000345932006038

Variance slope @ 2 km

0.000361287590065

Variance slope @ 5 km

0.000332237642704

Variance slope @ 10 km

0.000230840905672

Variance slope @ 20 km

0.00017013549718


NDVI (min. NDVI composite)I


Roman et al. (2009) index


St

2.21730123867

Rcv

0.161380129375

Rse

0.0

Rst

-0.306486161518

Rsv

0.885129841378


NDVI range @ 1km [-]

0.03

NDVI range @ 2km [-]

0.1

NDVI range @ 5km [-]

0.13

NDVI range @ 10km [-]

0.1

NDVI range @ 20km [-]

0.12


NDVI slope @ 1 km

0.000176194168948

NDVI slope @ 2 km

0.000187590646013

NDVI slope @ 5 km

0.000149933845048

NDVI slope @ 10 km

8.43658600163e-05

NDVI slope @ 20 km

5.75669524099e-05


Temporal stability analysis

+000 deg (BHR)


BHR statistics

Temporal stability [1/decade]:


abs

rel


Weighted least square:

None


Ordinary least square:

None


Probabilities that GCOS criteria is met:

Weighted least square:

None %

Ordinary least square:

None %


DHR statistics

Temporal stability [1/decade]:


abs

rel


Weighted least square:

None


Ordinary least square:

None


Probabilities that GCOS criteria is met:

Weighted least square:

None %

Ordinary least square:

None %


+057/+063 deg (BHR)


BHR statistics

Temporal stability [1/decade]:


abs

rel


Weighted least square:

None


Ordinary least square:

None


Probabilities that GCOS criteria is met:

Weighted least square:

None %

Ordinary least square:

None %


DHR statistics

Temporal stability [1/decade]:


abs

rel


Weighted least square:

None


Ordinary least square:

None


Probabilities that GCOS criteria is met:

Weighted least square:

None %

Ordinary least square:

None %


Temporal anomaly analyis

The variance of the temporal anomalies provides an additional measure about the stability of the signal AFTER removal of the mean seasonal cylce.

+000 deg


+057/+063 deg