DRAGON_NARA


Location

lon / lat [deg]: 135.828 / 34.688

Source network: AERONET


Geostationary surface albedo (GSA) data


“+000”


“+057/+063”


Landcover information (based on ESA CCI landcover data)


Landcover fractions @ 2km distance


Landcover fractions @ 20 km distance


Legend


Distance to open water bodies [km]:

16.63

Distance to urban areas [km]:

0.12


Radius: 1 km

Number of landcover classes:

1

Dominant landcover type:

190: urban areas

Fraction of dominant landcover type [%]:

100.0


Radius: 2 km

Number of landcover classes:

3

Dominant landcover type:

190: urban areas

Fraction of dominant landcover type [%]:

90.0


Radius: 5 km

Number of landcover classes:

6

Dominant landcover type:

190: urban areas

Fraction of dominant landcover type [%]:

66.0


Radius: 10 km

Number of landcover classes:

7

Dominant landcover type:

190: urban areas

Fraction of dominant landcover type [%]:

39.0


Radius: 20 km

Number of landcover classes:

7

Dominant landcover type:

190: urban areas

Fraction of dominant landcover type [%]:

33.0


Disturbances


Heterogeneity analysis

The heterogeneity analysis provides information about the spatial and temporal heterogeneity of the site.

Topography


Roman et al. (2009) index


St

0.894233148547

Rcv

0.45087671279

Rse

0.0

Rst

2.80367790691e-07

Rsv

2.90395279019


Height range @ 1km [m]

32

Height range @ 2km [m]

98

Height range @ 5km [m]

327

Height range @ 10km [m]

-999

Height range @ 20km [m]

-999


Variance slope @ 1 km

1168

Variance slope @ 2 km

1485

Variance slope @ 5 km

2353

Variance slope @ 10 km

-999

Variance slope @ 20 km

-999


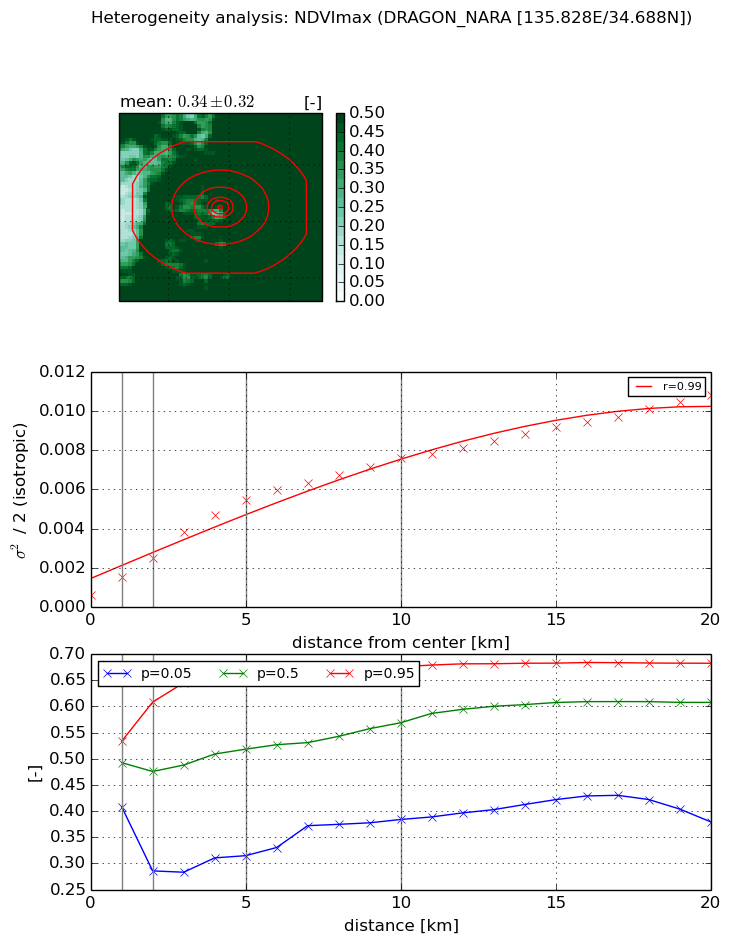
NDVI (max. NDVI composite)


Roman et al. (2009) index


St

3.58273338136

Rcv

-0.141098873697

Rse

0.0

Rst

-0.133093586732

Rsv

0.563157038031


NDVI range @ 1km [-]

0.13

NDVI range @ 2km [-]

0.32

NDVI range @ 5km [-]

0.35

NDVI range @ 10km [-]

0.29

NDVI range @ 20km [-]

0.3


Variance slope @ 1 km

0.000900555368632

Variance slope @ 2 km

0.000941485260506

Variance slope @ 5 km

0.00100321010708

Variance slope @ 10 km

0.000696091618322

Variance slope @ 20 km

0.000458337976744


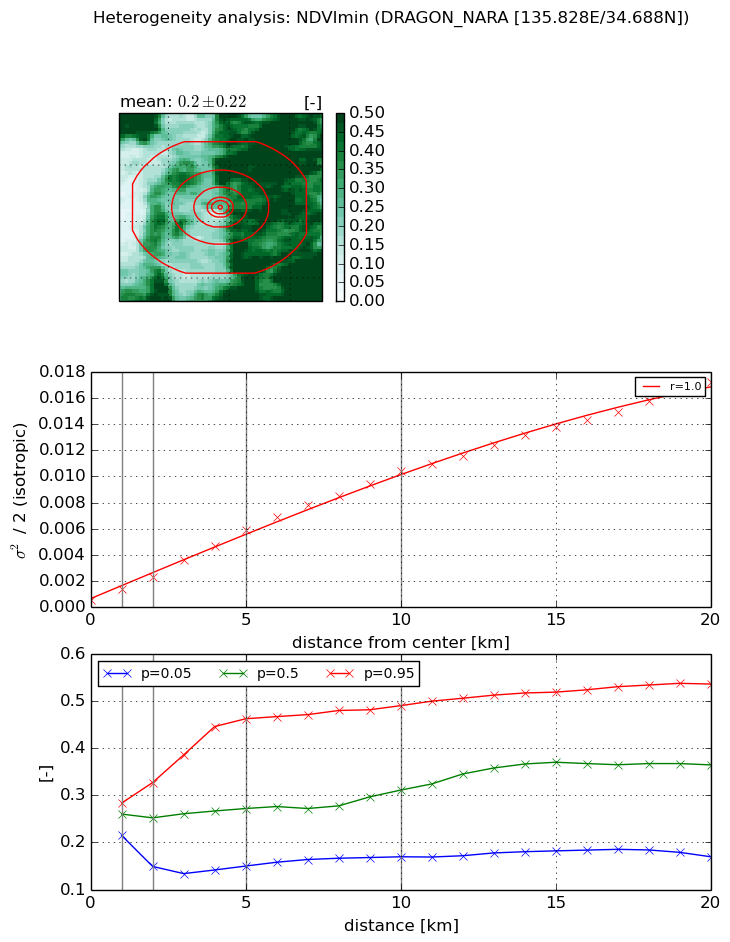
NDVI (min. NDVI composite)I


Roman et al. (2009) index


St

3.63503099302

Rcv

0.137833488292

Rse

0.0

Rst

-0.18908690959

Rsv

0.498382056418


NDVI range @ 1km [-]

0.07

NDVI range @ 2km [-]

0.18

NDVI range @ 5km [-]

0.31

NDVI range @ 10km [-]

0.32

NDVI range @ 20km [-]

0.37


NDVI slope @ 1 km

0.000809794666775

NDVI slope @ 2 km

0.000868909213761

NDVI slope @ 5 km

0.00108732830824

NDVI slope @ 10 km

0.00100531098322

NDVI slope @ 20 km

0.000825450231254


Temporal stability analysis

+000 deg (BHR)


BHR statistics

Temporal stability [1/decade]:


abs

rel


Weighted least square:

None


Ordinary least square:

None


Probabilities that GCOS criteria is met:

Weighted least square:

None %

Ordinary least square:

None %


DHR statistics

Temporal stability [1/decade]:


abs

rel


Weighted least square:

None


Ordinary least square:

None


Probabilities that GCOS criteria is met:

Weighted least square:

None %

Ordinary least square:

None %


+057/+063 deg (BHR)


BHR statistics

Temporal stability [1/decade]:


abs

rel


Weighted least square:

-99999.0


Ordinary least square:

-99999.0


Probabilities that GCOS criteria is met:

Weighted least square:

-99999.0 %

Ordinary least square:

-99999.0 %


DHR statistics

Temporal stability [1/decade]:


abs

rel


Weighted least square:

-99999.0


Ordinary least square:

-99999.0


Probabilities that GCOS criteria is met:

Weighted least square:

-99999.0 %

Ordinary least square:

-99999.0 %


Temporal anomaly analyis

The variance of the temporal anomalies provides an additional measure about the stability of the signal AFTER removal of the mean seasonal cylce.

+000 deg


+057/+063 deg