DRAGON_NIWOT_RIDGE


Location

lon / lat [deg]: -105.5333 / 40.0318

Source network: AERONET


Geostationary surface albedo (GSA) data


“+000”


“+057/+063”


Landcover information (based on ESA CCI landcover data)


Landcover fractions @ 2km distance


Landcover fractions @ 20 km distance


Legend


Distance to open water bodies [km]:

2.65

Distance to urban areas [km]:

2.16


Radius: 1 km

Number of landcover classes:

1

Dominant landcover type:

70: Tree cover, needleleaved, evergreen, closed to open (>15%)

Fraction of dominant landcover type [%]:

100.0


Radius: 2 km

Number of landcover classes:

2

Dominant landcover type:

70: Tree cover, needleleaved, evergreen, closed to open (>15%)

Fraction of dominant landcover type [%]:

97.0


Radius: 5 km

Number of landcover classes:

3

Dominant landcover type:

70: Tree cover, needleleaved, evergreen, closed to open (>15%)

Fraction of dominant landcover type [%]:

91.0


Radius: 10 km

Number of landcover classes:

7

Dominant landcover type:

70: Tree cover, needleleaved, evergreen, closed to open (>15%)

Fraction of dominant landcover type [%]:

79.0


Radius: 20 km

Number of landcover classes:

6

Dominant landcover type:

70: Tree cover, needleleaved, evergreen, closed to open (>15%)

Fraction of dominant landcover type [%]:

82.0


Disturbances


Heterogeneity analysis

The heterogeneity analysis provides information about the spatial and temporal heterogeneity of the site.

Topography


Roman et al. (2009) index


St

0.251257531355

Rcv

0.533758914766

Rse

0.0

Rst

3.53602647324e-07

Rsv

11.4061813329


Height range @ 1km [m]

206

Height range @ 2km [m]

349

Height range @ 5km [m]

779

Height range @ 10km [m]

-999

Height range @ 20km [m]

-999


Variance slope @ 1 km

5223

Variance slope @ 2 km

6847

Variance slope @ 5 km

11069

Variance slope @ 10 km

-999

Variance slope @ 20 km

-999


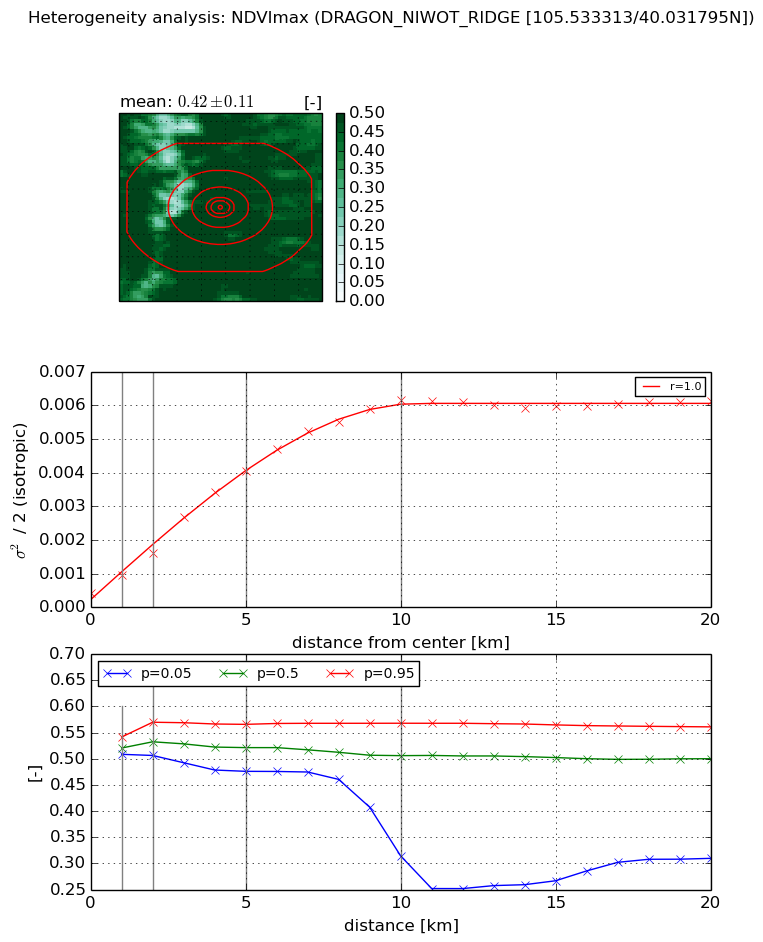
NDVI (max. NDVI composite)


Roman et al. (2009) index


St

5.34617605624

Rcv

0.11694374049

Rse

0.0

Rst

-0.0896904373153

Rsv

0.354514570093


NDVI range @ 1km [-]

0.03

NDVI range @ 2km [-]

0.06

NDVI range @ 5km [-]

0.09

NDVI range @ 10km [-]

0.25

NDVI range @ 20km [-]

0.25


Variance slope @ 1 km

0.000549147976179

Variance slope @ 2 km

0.000604297023395

Variance slope @ 5 km

0.000760889433403

Variance slope @ 10 km

0.000604653648689

Variance slope @ 20 km

0.00025464866585


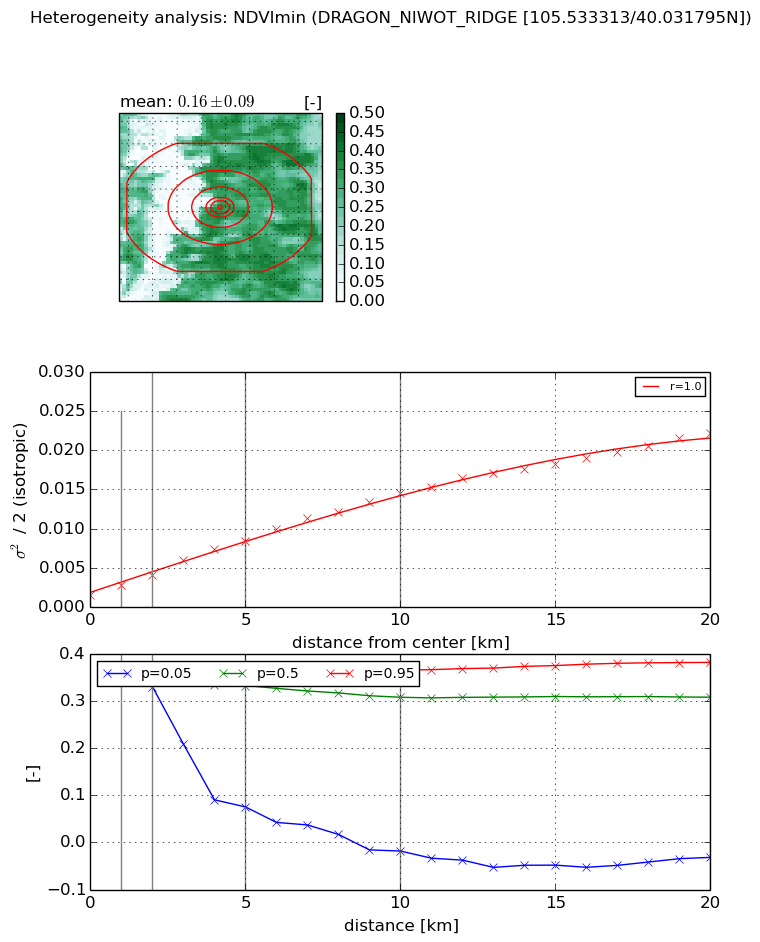
NDVI (min. NDVI composite)I


Roman et al. (2009) index


St

6.35867924532e-09

Rcv

0.803201406549

Rse

0.0

Rst

0.0559294782031

Rsv

471796088.275


NDVI range @ 1km [-]

0.01

NDVI range @ 2km [-]

0.03

NDVI range @ 5km [-]

0.29

NDVI range @ 10km [-]

0.38

NDVI range @ 20km [-]

0.41


NDVI slope @ 1 km

0.00122215124494

NDVI slope @ 2 km

0.00122887366447

NDVI slope @ 5 km

0.00143654520969

NDVI slope @ 10 km

0.00131421929617

NDVI slope @ 20 km

0.00101228987784


Temporal stability analysis

+000 deg (BHR)


BHR statistics

Temporal stability [1/decade]:


abs

rel


Weighted least square:

None


Ordinary least square:

None


Probabilities that GCOS criteria is met:

Weighted least square:

None %

Ordinary least square:

None %


DHR statistics

Temporal stability [1/decade]:


abs

rel


Weighted least square:

None


Ordinary least square:

None


Probabilities that GCOS criteria is met:

Weighted least square:

None %

Ordinary least square:

None %


+057/+063 deg (BHR)


BHR statistics

Temporal stability [1/decade]:


abs

rel


Weighted least square:

None


Ordinary least square:

None


Probabilities that GCOS criteria is met:

Weighted least square:

None %

Ordinary least square:

None %


DHR statistics

Temporal stability [1/decade]:


abs

rel


Weighted least square:

None


Ordinary least square:

None


Probabilities that GCOS criteria is met:

Weighted least square:

None %

Ordinary least square:

None %


Temporal anomaly analyis

The variance of the temporal anomalies provides an additional measure about the stability of the signal AFTER removal of the mean seasonal cylce.

+000 deg


+057/+063 deg