DRAGON_PARLIER


Location

lon / lat [deg]: -119.5037 / 36.5974

Source network: AERONET


Geostationary surface albedo (GSA) data


“+000”


“+057/+063”


Landcover information (based on ESA CCI landcover data)


Landcover fractions @ 2km distance


Landcover fractions @ 20 km distance


Legend


Distance to open water bodies [km]:

9.5

Distance to urban areas [km]:

1.84


Radius: 1 km

Number of landcover classes:

2

Dominant landcover type:

10: cropland, rainfed

Fraction of dominant landcover type [%]:

88.0


Radius: 2 km

Number of landcover classes:

3

Dominant landcover type:

10: cropland, rainfed

Fraction of dominant landcover type [%]:

75.0


Radius: 5 km

Number of landcover classes:

3

Dominant landcover type:

10: cropland, rainfed

Fraction of dominant landcover type [%]:

61.0


Radius: 10 km

Number of landcover classes:

5

Dominant landcover type:

10: cropland, rainfed

Fraction of dominant landcover type [%]:

57.0


Radius: 20 km

Number of landcover classes:

4

Dominant landcover type:

10: cropland, rainfed

Fraction of dominant landcover type [%]:

54.0


Disturbances


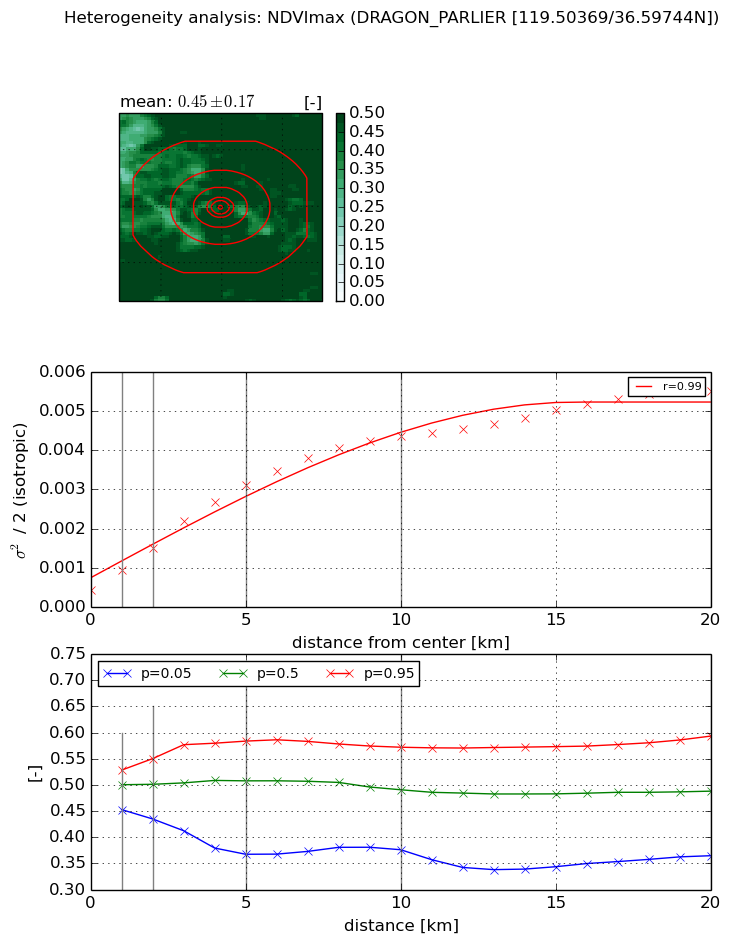
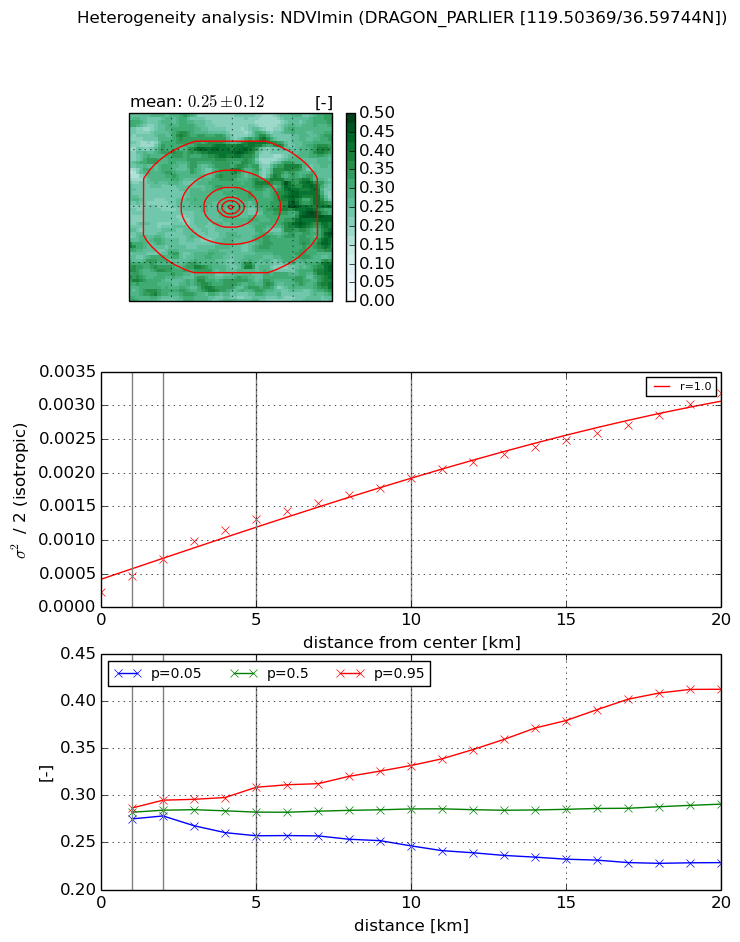
Heterogeneity analysis

The heterogeneity analysis provides information about the spatial and temporal heterogeneity of the site.

Topography


Roman et al. (2009) index


St

0.315900561072

Rcv

0.628167258189

Rse

0.0

Rst

-3.64578431876e-08

Rsv

8.86849200163


Height range @ 1km [m]

4

Height range @ 2km [m]

6

Height range @ 5km [m]

12

Height range @ 10km [m]

-999

Height range @ 20km [m]

-999


Variance slope @ 1 km

5

Variance slope @ 2 km

3

Variance slope @ 5 km

1

Variance slope @ 10 km

-999

Variance slope @ 20 km

-999


NDVI (max. NDVI composite)


Roman et al. (2009) index


St

2.70154048396

Rcv

0.32066814306

Rse

0.0

Rst

-0.160725992155

Rsv

0.62908339337


NDVI range @ 1km [-]

0.08

NDVI range @ 2km [-]

0.12

NDVI range @ 5km [-]

0.22

NDVI range @ 10km [-]

0.2

NDVI range @ 20km [-]

0.23


Variance slope @ 1 km

0.000507720215027

Variance slope @ 2 km

0.00053726190624

Variance slope @ 5 km

0.000551345296567

Variance slope @ 10 km

0.000404404385758

Variance slope @ 20 km

0.000232612311766


NDVI (min. NDVI composite)I


Roman et al. (2009) index


St

2.12603348451

Rcv

1.05912507313

Rse

0.0

Rst

-0.00795825567009

Rsv

0.343995105219


NDVI range @ 1km [-]

0.01

NDVI range @ 2km [-]

0.02

NDVI range @ 5km [-]

0.05

NDVI range @ 10km [-]

0.09

NDVI range @ 20km [-]

0.18


NDVI slope @ 1 km

0.000240760879643

NDVI slope @ 2 km

0.000244446846405

NDVI slope @ 5 km

0.000220185673533

NDVI slope @ 10 km

0.000162406329745

NDVI slope @ 20 km

0.000134479210491


Temporal stability analysis

+000 deg (BHR)


BHR statistics

Temporal stability [1/decade]:


abs

rel


Weighted least square:

None


Ordinary least square:

None


Probabilities that GCOS criteria is met:

Weighted least square:

None %

Ordinary least square:

None %


DHR statistics

Temporal stability [1/decade]:


abs

rel


Weighted least square:

None


Ordinary least square:

None


Probabilities that GCOS criteria is met:

Weighted least square:

None %

Ordinary least square:

None %


+057/+063 deg (BHR)


BHR statistics

Temporal stability [1/decade]:


abs

rel


Weighted least square:

None


Ordinary least square:

None


Probabilities that GCOS criteria is met:

Weighted least square:

None %

Ordinary least square:

None %


DHR statistics

Temporal stability [1/decade]:


abs

rel


Weighted least square:

None


Ordinary least square:

None


Probabilities that GCOS criteria is met:

Weighted least square:

None %

Ordinary least square:

None %


Temporal anomaly analyis

The variance of the temporal anomalies provides an additional measure about the stability of the signal AFTER removal of the mean seasonal cylce.

+000 deg


+057/+063 deg