DRAGON_PORTERVILLE


Location

lon / lat [deg]: -119.055 / 36.0318

Source network: AERONET


Geostationary surface albedo (GSA) data


“+000”


“+057/+063”


Landcover information (based on ESA CCI landcover data)


Landcover fractions @ 2km distance


Landcover fractions @ 20 km distance


Legend


Distance to open water bodies [km]:

12.58

Distance to urban areas [km]:

0.92


Radius: 1 km

Number of landcover classes:

4

Dominant landcover type:

130: grassland

Fraction of dominant landcover type [%]:

68.0


Radius: 2 km

Number of landcover classes:

4

Dominant landcover type:

130: grassland

Fraction of dominant landcover type [%]:

64.0


Radius: 5 km

Number of landcover classes:

4

Dominant landcover type:

130: grassland

Fraction of dominant landcover type [%]:

48.0


Radius: 10 km

Number of landcover classes:

4

Dominant landcover type:

130: grassland

Fraction of dominant landcover type [%]:

55.0


Radius: 20 km

Number of landcover classes:

4

Dominant landcover type:

130: grassland

Fraction of dominant landcover type [%]:

59.0


Disturbances


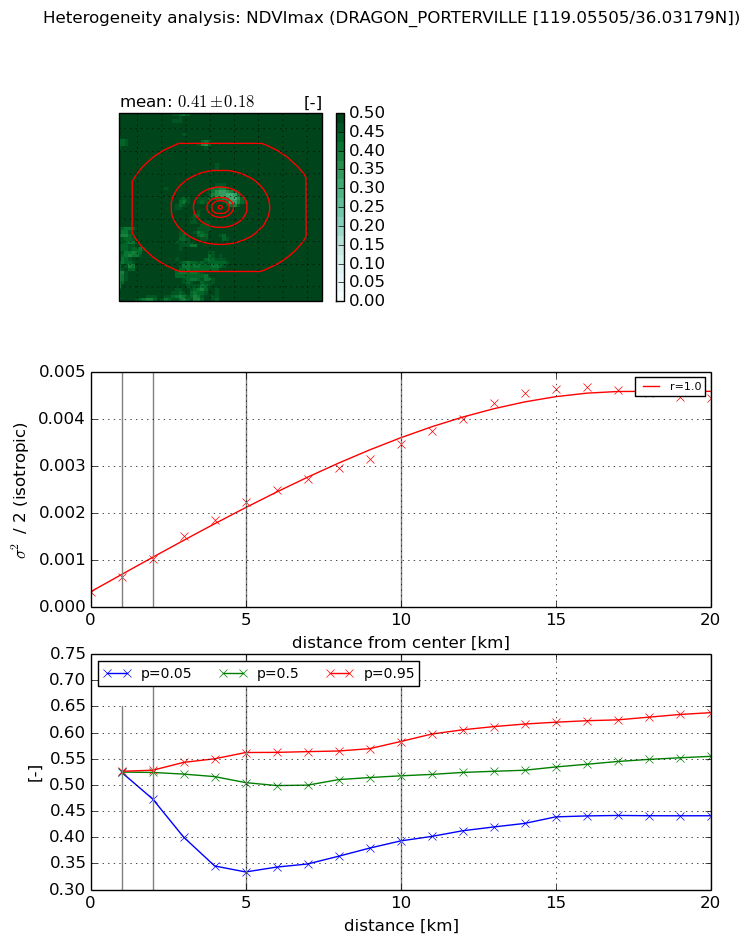
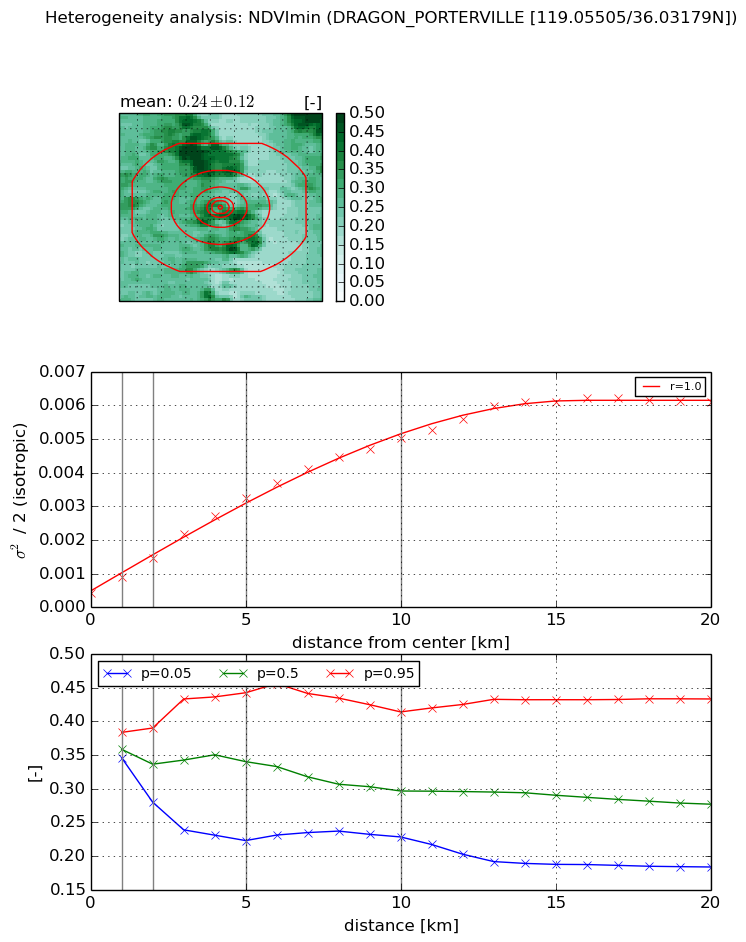
Heterogeneity analysis

The heterogeneity analysis provides information about the spatial and temporal heterogeneity of the site.

Topography


Roman et al. (2009) index


St

0.773103643632

Rcv

0.545492910986

Rse

0.0

Rst

8.61951849119e-06

Rsv

3.33496136048


Height range @ 1km [m]

8

Height range @ 2km [m]

12

Height range @ 5km [m]

27

Height range @ 10km [m]

-999

Height range @ 20km [m]

-999


Variance slope @ 1 km

6

Variance slope @ 2 km

7

Variance slope @ 5 km

14

Variance slope @ 10 km

-999

Variance slope @ 20 km

-999


NDVI (max. NDVI composite)


Roman et al. (2009) index


St

1.7619662133e-08

Rcv

0.53799001345

Rse

0.0

Rst

0.218234085956

Rsv

170264331.066


NDVI range @ 1km [-]

0.0

NDVI range @ 2km [-]

0.05

NDVI range @ 5km [-]

0.23

NDVI range @ 10km [-]

0.19

NDVI range @ 20km [-]

0.2


Variance slope @ 1 km

0.000335693134405

Variance slope @ 2 km

0.000358414183454

Variance slope @ 5 km

0.000390758711625

Variance slope @ 10 km

0.000315324250047

Variance slope @ 20 km

0.000221097882741


NDVI (min. NDVI composite)I


Roman et al. (2009) index


St

3.85598599949e-08

Rcv

0.225243278712

Rse

0.0

Rst

0.0717440248281

Rsv

77801112.0617


NDVI range @ 1km [-]

0.04

NDVI range @ 2km [-]

0.11

NDVI range @ 5km [-]

0.22

NDVI range @ 10km [-]

0.19

NDVI range @ 20km [-]

0.25


NDVI slope @ 1 km

0.000487457451121

NDVI slope @ 2 km

0.000527059477125

NDVI slope @ 5 km

0.000579612276234

NDVI slope @ 10 km

0.00047500274333

NDVI slope @ 20 km

0.000290117764916


Temporal stability analysis

+000 deg (BHR)


BHR statistics

Temporal stability [1/decade]:


abs

rel


Weighted least square:

None


Ordinary least square:

None


Probabilities that GCOS criteria is met:

Weighted least square:

None %

Ordinary least square:

None %


DHR statistics

Temporal stability [1/decade]:


abs

rel


Weighted least square:

None


Ordinary least square:

None


Probabilities that GCOS criteria is met:

Weighted least square:

None %

Ordinary least square:

None %


+057/+063 deg (BHR)


BHR statistics

Temporal stability [1/decade]:


abs

rel


Weighted least square:

None


Ordinary least square:

None


Probabilities that GCOS criteria is met:

Weighted least square:

None %

Ordinary least square:

None %


DHR statistics

Temporal stability [1/decade]:


abs

rel


Weighted least square:

None


Ordinary least square:

None


Probabilities that GCOS criteria is met:

Weighted least square:

None %

Ordinary least square:

None %


Temporal anomaly analyis

The variance of the temporal anomalies provides an additional measure about the stability of the signal AFTER removal of the mean seasonal cylce.

+000 deg


+057/+063 deg