DRAGON_RCKMD


Location

lon / lat [deg]: -77.0962 / 39.0656

Source network: AERONET


Geostationary surface albedo (GSA) data


“+000”


“+057/+063”


Landcover information (based on ESA CCI landcover data)


Landcover fractions @ 2km distance


Landcover fractions @ 20 km distance


Legend


Distance to open water bodies [km]:

4.61

Distance to urban areas [km]:

0.05


Radius: 1 km

Number of landcover classes:

1

Dominant landcover type:

190: urban areas

Fraction of dominant landcover type [%]:

100.0


Radius: 2 km

Number of landcover classes:

1

Dominant landcover type:

190: urban areas

Fraction of dominant landcover type [%]:

100.0


Radius: 5 km

Number of landcover classes:

1

Dominant landcover type:

190: urban areas

Fraction of dominant landcover type [%]:

98.0


Radius: 10 km

Number of landcover classes:

3

Dominant landcover type:

190: urban areas

Fraction of dominant landcover type [%]:

85.0


Radius: 20 km

Number of landcover classes:

6

Dominant landcover type:

190: urban areas

Fraction of dominant landcover type [%]:

62.0


Disturbances


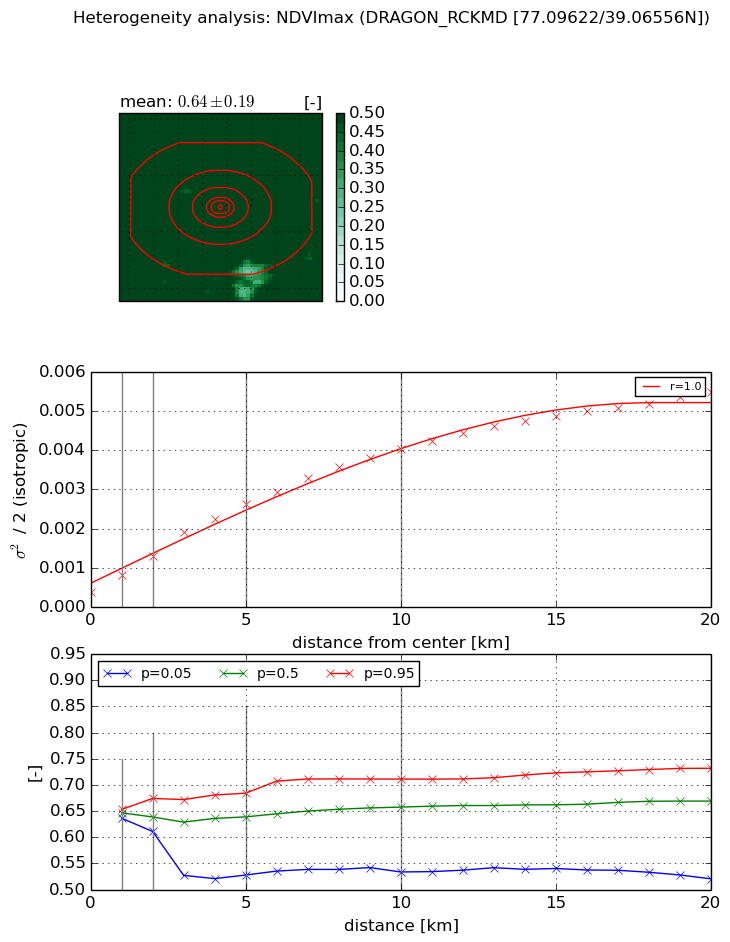
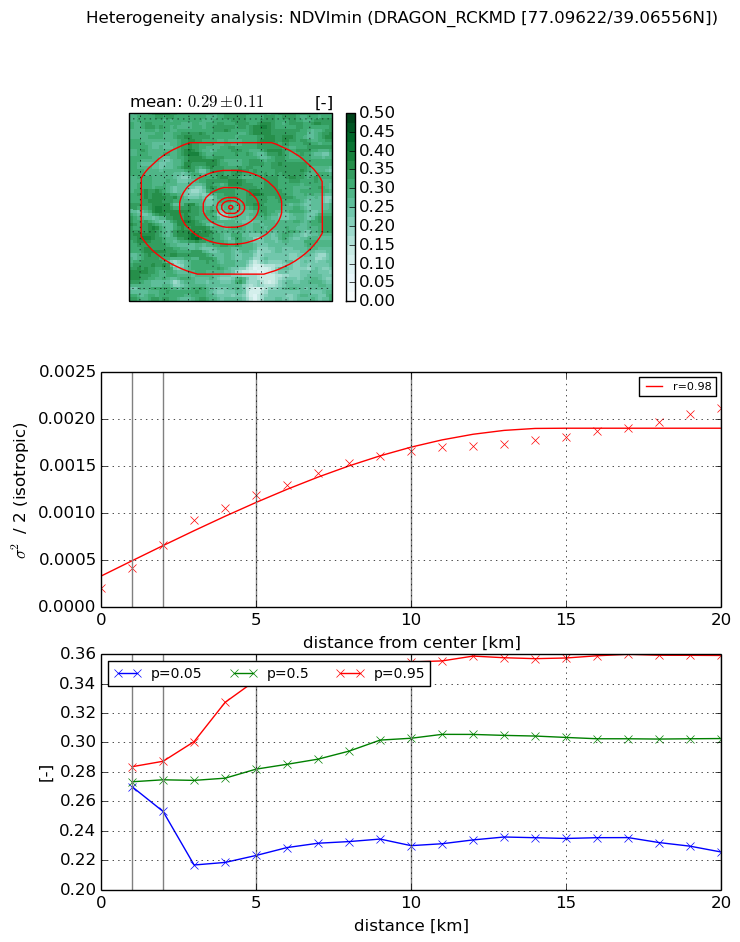
Heterogeneity analysis

The heterogeneity analysis provides information about the spatial and temporal heterogeneity of the site.

Topography


Roman et al. (2009) index


St

2.10733651086

Rcv

0.183708956212

Rse

0.0

Rst

-0.0636575786495

Rsv

1.17623144512


Height range @ 1km [m]

29

Height range @ 2km [m]

37

Height range @ 5km [m]

52

Height range @ 10km [m]

-999

Height range @ 20km [m]

-999


Variance slope @ 1 km

91

Variance slope @ 2 km

80

Variance slope @ 5 km

57

Variance slope @ 10 km

-999

Variance slope @ 20 km

-999


NDVI (max. NDVI composite)


Roman et al. (2009) index


St

4.1255638558e-07

Rcv

-0.0224658615522

Rse

0.0

Rst

0.620425383028

Rsv

7271732.63977


NDVI range @ 1km [-]

0.02

NDVI range @ 2km [-]

0.06

NDVI range @ 5km [-]

0.16

NDVI range @ 10km [-]

0.18

NDVI range @ 20km [-]

0.21


Variance slope @ 1 km

0.00044533079065

Variance slope @ 2 km

0.000468473237127

Variance slope @ 5 km

0.00046105865283

Variance slope @ 10 km

0.000366934539863

Variance slope @ 20 km

0.00024175940443


NDVI (min. NDVI composite)I


Roman et al. (2009) index


St

1.82539634558e-07

Rcv

0.233935000434

Rse

0.0

Rst

0.0565184785912

Rsv

16434786.6382


NDVI range @ 1km [-]

0.01

NDVI range @ 2km [-]

0.03

NDVI range @ 5km [-]

0.12

NDVI range @ 10km [-]

0.12

NDVI range @ 20km [-]

0.13


NDVI slope @ 1 km

0.000221407634496

NDVI slope @ 2 km

0.000231165487806

NDVI slope @ 5 km

0.00020303995366

NDVI slope @ 10 km

0.000144110342534

NDVI slope @ 20 km

8.11589161104e-05


Temporal stability analysis

+000 deg (BHR)


BHR statistics

Temporal stability [1/decade]:


abs

rel


Weighted least square:

-99999.0


Ordinary least square:

-99999.0


Probabilities that GCOS criteria is met:

Weighted least square:

-99999.0 %

Ordinary least square:

-99999.0 %


DHR statistics

Temporal stability [1/decade]:


abs

rel


Weighted least square:

-99999.0


Ordinary least square:

-99999.0


Probabilities that GCOS criteria is met:

Weighted least square:

-99999.0 %

Ordinary least square:

-99999.0 %


+057/+063 deg (BHR)


BHR statistics

Temporal stability [1/decade]:


abs

rel


Weighted least square:

None


Ordinary least square:

None


Probabilities that GCOS criteria is met:

Weighted least square:

None %

Ordinary least square:

None %


DHR statistics

Temporal stability [1/decade]:


abs

rel


Weighted least square:

None


Ordinary least square:

None


Probabilities that GCOS criteria is met:

Weighted least square:

None %

Ordinary least square:

None %


Temporal anomaly analyis

The variance of the temporal anomalies provides an additional measure about the stability of the signal AFTER removal of the mean seasonal cylce.

+000 deg


+057/+063 deg