DRAGON_UH_SUGARLAND


Location

lon / lat [deg]: -95.652 / 29.5741

Source network: AERONET


Geostationary surface albedo (GSA) data


“+000”


“+057/+063”


Landcover information (based on ESA CCI landcover data)


Landcover fractions @ 2km distance


Landcover fractions @ 20 km distance


Legend


Distance to open water bodies [km]:

1.58

Distance to urban areas [km]:

0.54


Radius: 1 km

Number of landcover classes:

3

Dominant landcover type:

130: grassland

Fraction of dominant landcover type [%]:

65.0


Radius: 2 km

Number of landcover classes:

5

Dominant landcover type:

130: grassland

Fraction of dominant landcover type [%]:

56.0


Radius: 5 km

Number of landcover classes:

5

Dominant landcover type:

190: urban areas

Fraction of dominant landcover type [%]:

58.0


Radius: 10 km

Number of landcover classes:

8

Dominant landcover type:

130: grassland

Fraction of dominant landcover type [%]:

41.0


Radius: 20 km

Number of landcover classes:

7

Dominant landcover type:

130: grassland

Fraction of dominant landcover type [%]:

45.0


Disturbances


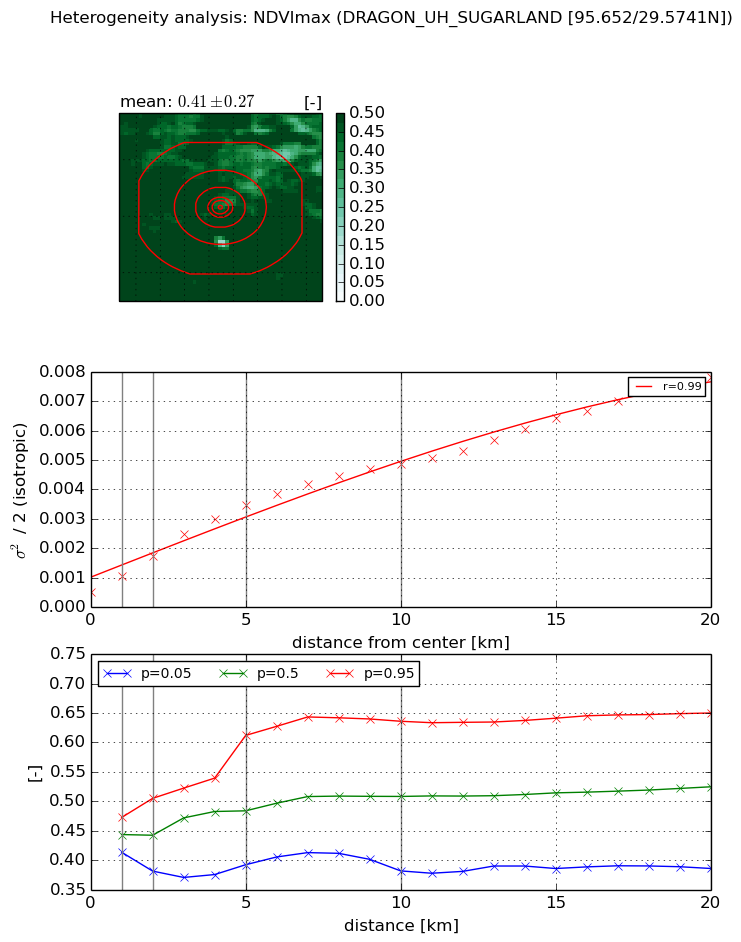
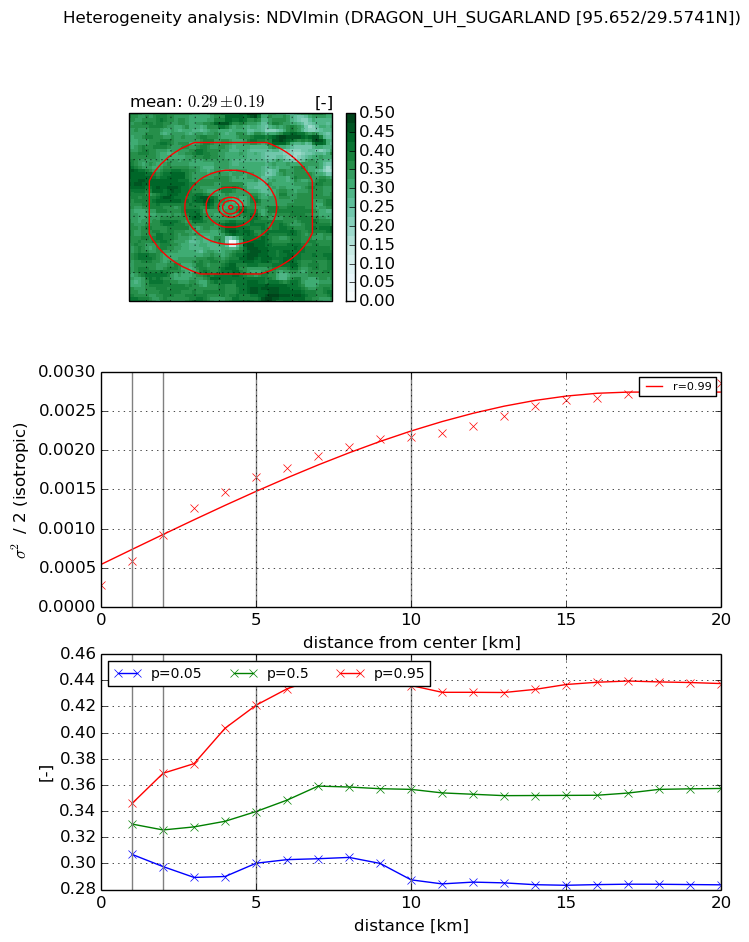
Heterogeneity analysis

The heterogeneity analysis provides information about the spatial and temporal heterogeneity of the site.

Topography


Roman et al. (2009) index


St

1.16169935871

Rcv

-0.0490535536848

Rse

0.0

Rst

-0.408233407164

Rsv

2.12513677685


Height range @ 1km [m]

6

Height range @ 2km [m]

9

Height range @ 5km [m]

9

Height range @ 10km [m]

-999

Height range @ 20km [m]

-999


Variance slope @ 1 km

4

Variance slope @ 2 km

2

Variance slope @ 5 km

0

Variance slope @ 10 km

-999

Variance slope @ 20 km

-999


NDVI (max. NDVI composite)


Roman et al. (2009) index


St

1.22626547142e-05

Rcv

0.218931398724

Rse

0.0

Rst

0.251238209818

Rsv

244644.76122


NDVI range @ 1km [-]

0.06

NDVI range @ 2km [-]

0.12

NDVI range @ 5km [-]

0.22

NDVI range @ 10km [-]

0.25

NDVI range @ 20km [-]

0.26


Variance slope @ 1 km

0.000568090694968

Variance slope @ 2 km

0.000610853071793

Variance slope @ 5 km

0.000611097487803

Variance slope @ 10 km

0.000444031330094

Variance slope @ 20 km

0.00033915321544


NDVI (min. NDVI composite)I


Roman et al. (2009) index


St

2.08300961674

Rcv

0.228074970472

Rse

0.0

Rst

-0.317740982987

Rsv

0.894407834225


NDVI range @ 1km [-]

0.04

NDVI range @ 2km [-]

0.07

NDVI range @ 5km [-]

0.12

NDVI range @ 10km [-]

0.15

NDVI range @ 20km [-]

0.15


NDVI slope @ 1 km

0.000304244860874

NDVI slope @ 2 km

0.000320082375446

NDVI slope @ 5 km

0.000281625616521

NDVI slope @ 10 km

0.000187538468117

NDVI slope @ 20 km

0.000115050512179


Temporal stability analysis

+000 deg (BHR)


BHR statistics

Temporal stability [1/decade]:


abs

rel


Weighted least square:

None


Ordinary least square:

None


Probabilities that GCOS criteria is met:

Weighted least square:

None %

Ordinary least square:

None %


DHR statistics

Temporal stability [1/decade]:


abs

rel


Weighted least square:

None


Ordinary least square:

None


Probabilities that GCOS criteria is met:

Weighted least square:

None %

Ordinary least square:

None %


+057/+063 deg (BHR)


BHR statistics

Temporal stability [1/decade]:


abs

rel


Weighted least square:

None


Ordinary least square:

None


Probabilities that GCOS criteria is met:

Weighted least square:

None %

Ordinary least square:

None %


DHR statistics

Temporal stability [1/decade]:


abs

rel


Weighted least square:

None


Ordinary least square:

None


Probabilities that GCOS criteria is met:

Weighted least square:

None %

Ordinary least square:

None %


Temporal anomaly analyis

The variance of the temporal anomalies provides an additional measure about the stability of the signal AFTER removal of the mean seasonal cylce.

+000 deg


+057/+063 deg