DRAGON_WELD_CO_TWR


Location

lon / lat [deg]: -104.7374 / 40.3864

Source network: AERONET


Geostationary surface albedo (GSA) data


“+000”


“+057/+063”


Landcover information (based on ESA CCI landcover data)


Landcover fractions @ 2km distance


Landcover fractions @ 20 km distance


Legend


Distance to open water bodies [km]:

5.7

Distance to urban areas [km]:

0.18


Radius: 1 km

Number of landcover classes:

3

Dominant landcover type:

190: urban areas

Fraction of dominant landcover type [%]:

79.0


Radius: 2 km

Number of landcover classes:

4

Dominant landcover type:

190: urban areas

Fraction of dominant landcover type [%]:

68.0


Radius: 5 km

Number of landcover classes:

5

Dominant landcover type:

190: urban areas

Fraction of dominant landcover type [%]:

59.0


Radius: 10 km

Number of landcover classes:

5

Dominant landcover type:

10: cropland, rainfed

Fraction of dominant landcover type [%]:

43.0


Radius: 20 km

Number of landcover classes:

5

Dominant landcover type:

10: cropland, rainfed

Fraction of dominant landcover type [%]:

56.0


Disturbances


Heterogeneity analysis

The heterogeneity analysis provides information about the spatial and temporal heterogeneity of the site.

Topography


Roman et al. (2009) index


St

8.58639296972

Rcv

0.284852122087

Rse

0.0

Rst

1.75939742119e-07

Rsv

0.064537720643


Height range @ 1km [m]

28

Height range @ 2km [m]

43

Height range @ 5km [m]

72

Height range @ 10km [m]

-999

Height range @ 20km [m]

-999


Variance slope @ 1 km

70

Variance slope @ 2 km

94

Variance slope @ 5 km

130

Variance slope @ 10 km

-999

Variance slope @ 20 km

-999


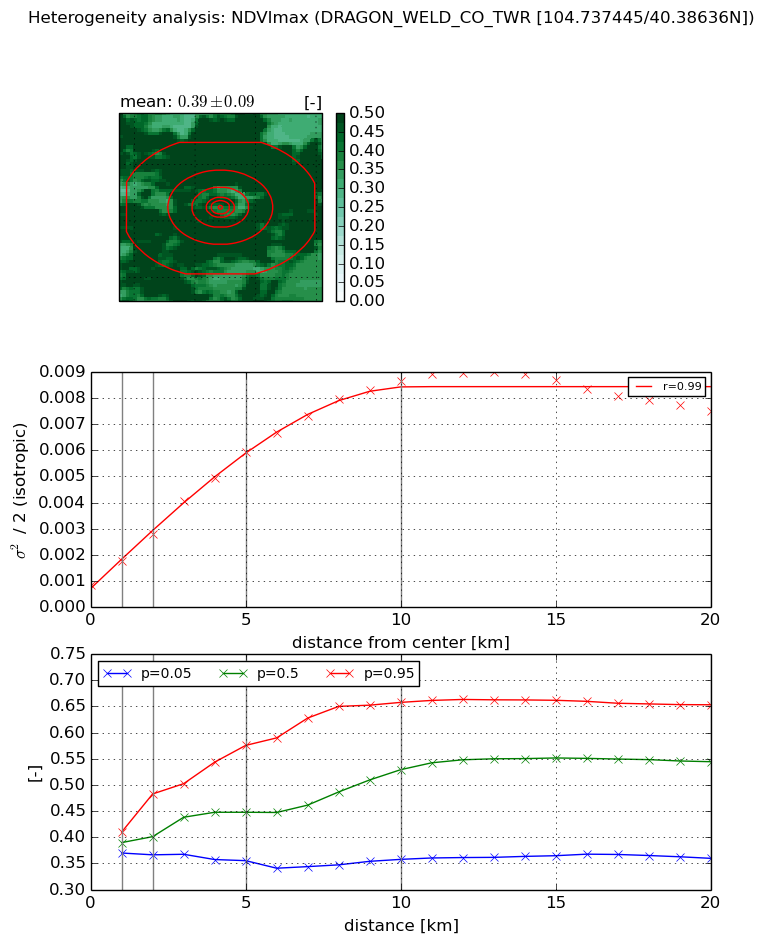
NDVI (max. NDVI composite)


Roman et al. (2009) index


St

1.75845032783

Rcv

0.356325130637

Rse

0.0

Rst

-0.349722983162

Rsv

-0.999999508084


NDVI range @ 1km [-]

0.04

NDVI range @ 2km [-]

0.12

NDVI range @ 5km [-]

0.22

NDVI range @ 10km [-]

0.3

NDVI range @ 20km [-]

0.29


Variance slope @ 1 km

0.000906948487051

Variance slope @ 2 km

0.000980587061136

Variance slope @ 5 km

0.00103668040739

Variance slope @ 10 km

0.000807943396413

Variance slope @ 20 km

0.000312385239936


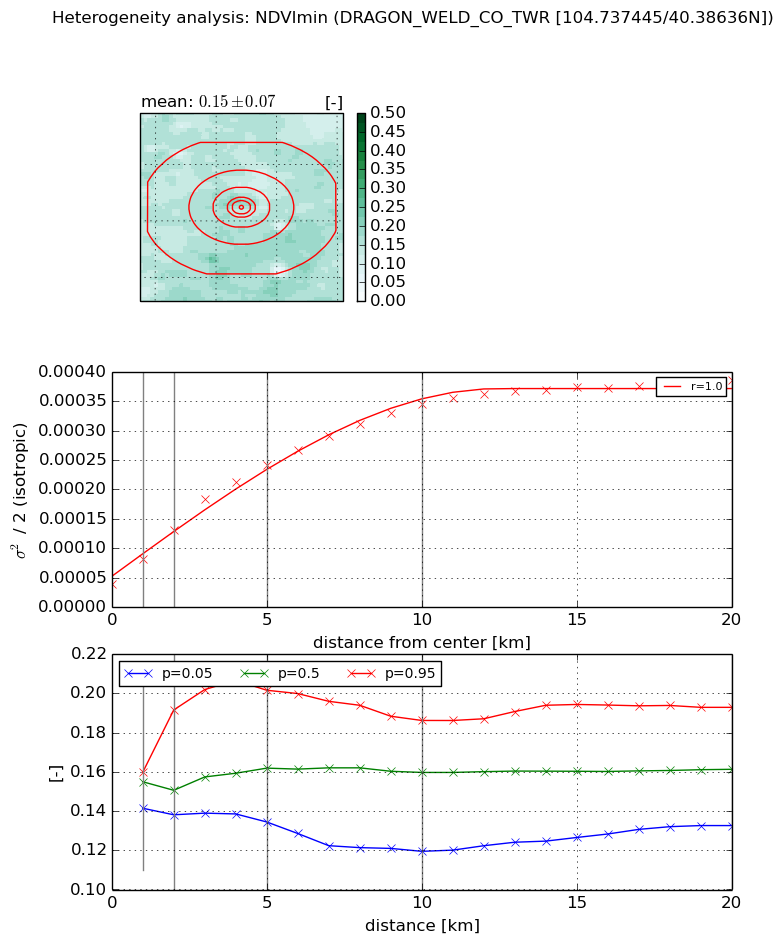
NDVI (min. NDVI composite)I


Roman et al. (2009) index


St

5.87959368767

Rcv

-0.0636786438601

Rse

0.0

Rst

0.0911755769126

Rsv

-0.355385118774


NDVI range @ 1km [-]

0.02

NDVI range @ 2km [-]

0.05

NDVI range @ 5km [-]

0.07

NDVI range @ 10km [-]

0.07

NDVI range @ 20km [-]

0.06


NDVI slope @ 1 km

4.26790422365e-05

NDVI slope @ 2 km

4.55632132642e-05

NDVI slope @ 5 km

4.17840588813e-05

NDVI slope @ 10 km

3.03536182396e-05

NDVI slope @ 20 km

1.53115455163e-05


Temporal stability analysis

+000 deg (BHR)


BHR statistics

Temporal stability [1/decade]:


abs

rel


Weighted least square:

None


Ordinary least square:

None


Probabilities that GCOS criteria is met:

Weighted least square:

None %

Ordinary least square:

None %


DHR statistics

Temporal stability [1/decade]:


abs

rel


Weighted least square:

None


Ordinary least square:

None


Probabilities that GCOS criteria is met:

Weighted least square:

None %

Ordinary least square:

None %


+057/+063 deg (BHR)


BHR statistics

Temporal stability [1/decade]:


abs

rel


Weighted least square:

None


Ordinary least square:

None


Probabilities that GCOS criteria is met:

Weighted least square:

None %

Ordinary least square:

None %


DHR statistics

Temporal stability [1/decade]:


abs

rel


Weighted least square:

None


Ordinary least square:

None


Probabilities that GCOS criteria is met:

Weighted least square:

None %

Ordinary least square:

None %


Temporal anomaly analyis

The variance of the temporal anomalies provides an additional measure about the stability of the signal AFTER removal of the mean seasonal cylce.

+000 deg


+057/+063 deg