DRAGON_WEST_HOUSTON


Location

lon / lat [deg]: -95.6569 / 29.8331

Source network: AERONET


Geostationary surface albedo (GSA) data


“+000”


“+057/+063”


Landcover information (based on ESA CCI landcover data)


Landcover fractions @ 2km distance


Landcover fractions @ 20 km distance


Legend


Distance to open water bodies [km]:

5.98

Distance to urban areas [km]:

0.12


Radius: 1 km

Number of landcover classes:

3

Dominant landcover type:

190: urban areas

Fraction of dominant landcover type [%]:

53.0


Radius: 2 km

Number of landcover classes:

4

Dominant landcover type:

190: urban areas

Fraction of dominant landcover type [%]:

56.0


Radius: 5 km

Number of landcover classes:

5

Dominant landcover type:

190: urban areas

Fraction of dominant landcover type [%]:

53.0


Radius: 10 km

Number of landcover classes:

7

Dominant landcover type:

190: urban areas

Fraction of dominant landcover type [%]:

65.0


Radius: 20 km

Number of landcover classes:

5

Dominant landcover type:

190: urban areas

Fraction of dominant landcover type [%]:

61.0


Disturbances


Heterogeneity analysis

The heterogeneity analysis provides information about the spatial and temporal heterogeneity of the site.

Topography


Roman et al. (2009) index


St

5.82314013853

Rcv

0.137472116996

Rse

0.0

Rst

-0.279466061634

Rsv

-0.0982477740738


Height range @ 1km [m]

8

Height range @ 2km [m]

9

Height range @ 5km [m]

11

Height range @ 10km [m]

-999

Height range @ 20km [m]

-999


Variance slope @ 1 km

5

Variance slope @ 2 km

3

Variance slope @ 5 km

1

Variance slope @ 10 km

-999

Variance slope @ 20 km

-999


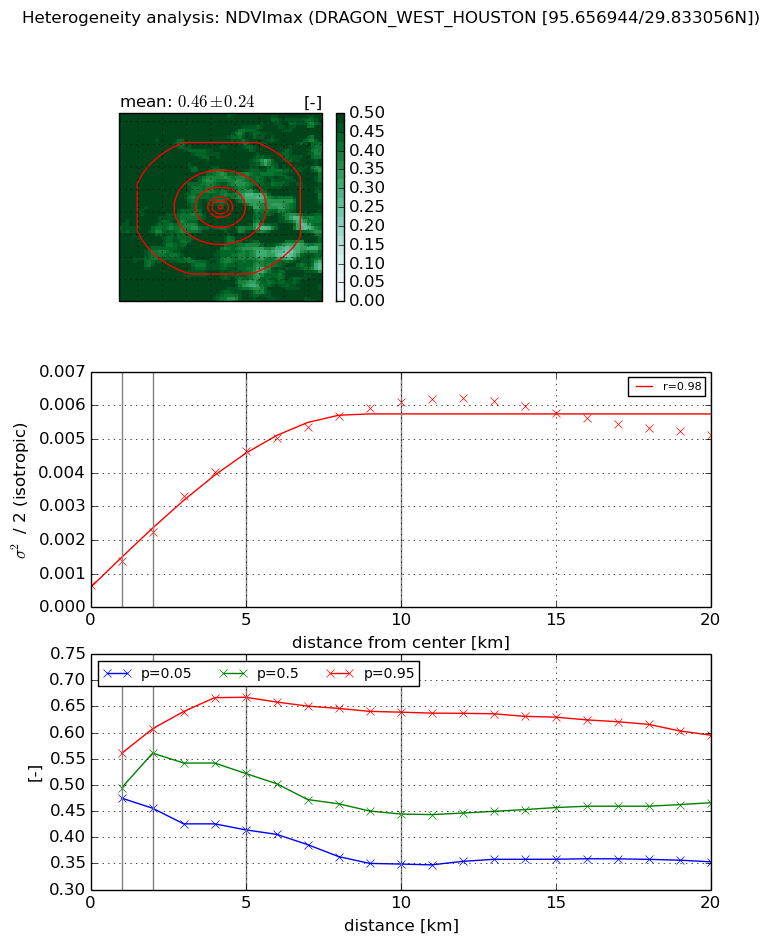
NDVI (max. NDVI composite)


Roman et al. (2009) index


St

9.66972445656e-07

Rcv

0.202865046769

Rse

0.0

Rst

0.159540829385

Rsv

3102466.53153


NDVI range @ 1km [-]

0.09

NDVI range @ 2km [-]

0.15

NDVI range @ 5km [-]

0.25

NDVI range @ 10km [-]

0.29

NDVI range @ 20km [-]

0.24


Variance slope @ 1 km

0.000718110968056

Variance slope @ 2 km

0.000795608847675

Variance slope @ 5 km

0.000828374993412

Variance slope @ 10 km

0.000553099775253

Variance slope @ 20 km

0.000184074971508


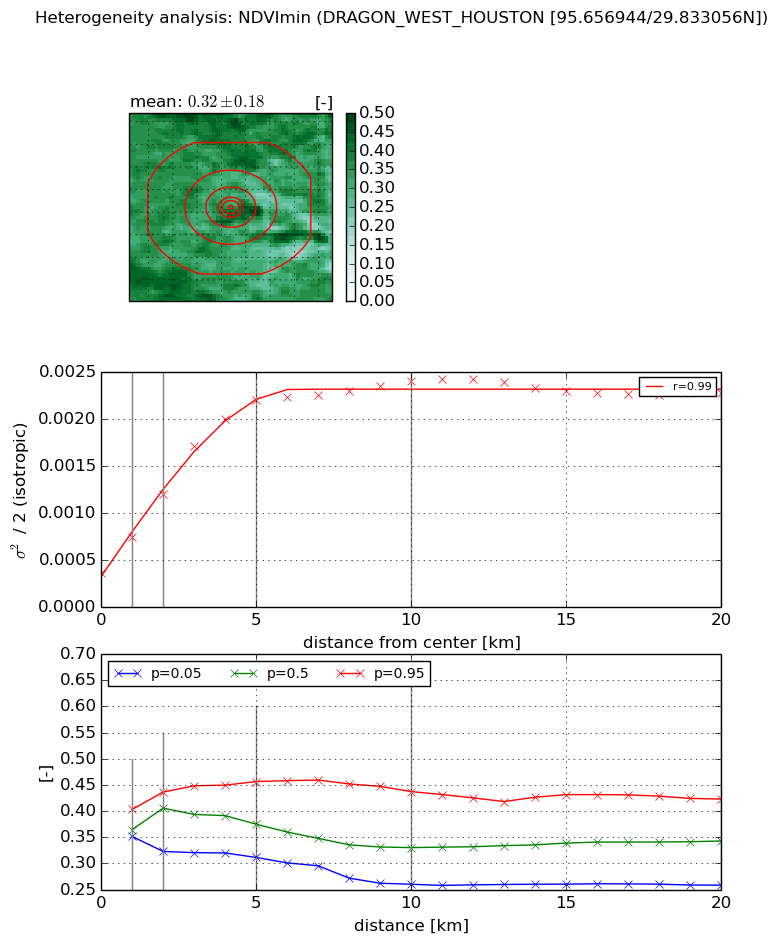
NDVI (min. NDVI composite)I


Roman et al. (2009) index


St

3.80907598574

Rcv

0.143933005649

Rse

0.0

Rst

-0.162631984767

Rsv

0.48102759404


NDVI range @ 1km [-]

0.05

NDVI range @ 2km [-]

0.11

NDVI range @ 5km [-]

0.15

NDVI range @ 10km [-]

0.18

NDVI range @ 20km [-]

0.16


NDVI slope @ 1 km

0.000383153536415

NDVI slope @ 2 km

0.000417981318698

NDVI slope @ 5 km

0.000383206392915

NDVI slope @ 10 km

0.000192044377111

NDVI slope @ 20 km

6.27877166441e-05


Temporal stability analysis

+000 deg (BHR)


BHR statistics

Temporal stability [1/decade]:


abs

rel


Weighted least square:

None


Ordinary least square:

None


Probabilities that GCOS criteria is met:

Weighted least square:

None %

Ordinary least square:

None %


DHR statistics

Temporal stability [1/decade]:


abs

rel


Weighted least square:

None


Ordinary least square:

None


Probabilities that GCOS criteria is met:

Weighted least square:

None %

Ordinary least square:

None %


+057/+063 deg (BHR)


BHR statistics

Temporal stability [1/decade]:


abs

rel


Weighted least square:

None


Ordinary least square:

None


Probabilities that GCOS criteria is met:

Weighted least square:

None %

Ordinary least square:

None %


DHR statistics

Temporal stability [1/decade]:


abs

rel


Weighted least square:

None


Ordinary least square:

None


Probabilities that GCOS criteria is met:

Weighted least square:

None %

Ordinary least square:

None %


Temporal anomaly analyis

The variance of the temporal anomalies provides an additional measure about the stability of the signal AFTER removal of the mean seasonal cylce.

+000 deg


+057/+063 deg