DRAGON_WILEYFORD


Location

lon / lat [deg]: -78.7736 / 39.6104

Source network: AERONET


Geostationary surface albedo (GSA) data


“+000”


“+057/+063”


Landcover information (based on ESA CCI landcover data)


Landcover fractions @ 2km distance


Landcover fractions @ 20 km distance


Legend


Distance to open water bodies [km]:

0.46

Distance to urban areas [km]:

0.08


Radius: 1 km

Number of landcover classes:

4

Dominant landcover type:

130: grassland

Fraction of dominant landcover type [%]:

51.0


Radius: 2 km

Number of landcover classes:

6

Dominant landcover type:

130: grassland

Fraction of dominant landcover type [%]:

43.0


Radius: 5 km

Number of landcover classes:

6

Dominant landcover type:

190: urban areas

Fraction of dominant landcover type [%]:

41.0


Radius: 10 km

Number of landcover classes:

5

Dominant landcover type:

130: grassland

Fraction of dominant landcover type [%]:

37.0


Radius: 20 km

Number of landcover classes:

4

Dominant landcover type:

61: Tree cover, broadleaved, decidous (closed > 40%)

Fraction of dominant landcover type [%]:

45.0


Disturbances


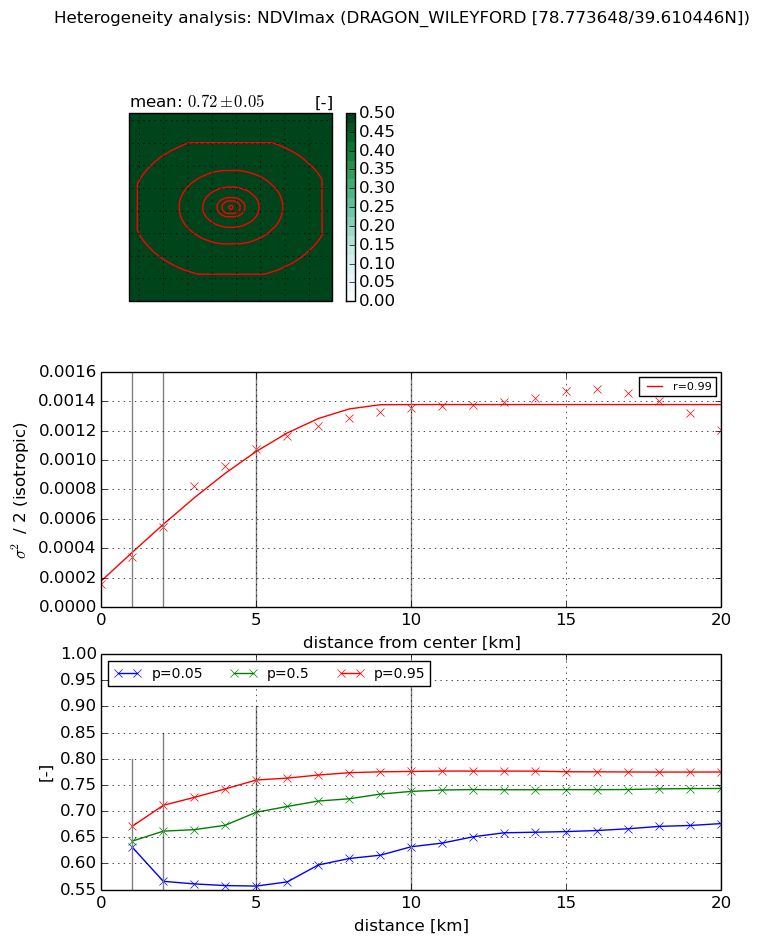
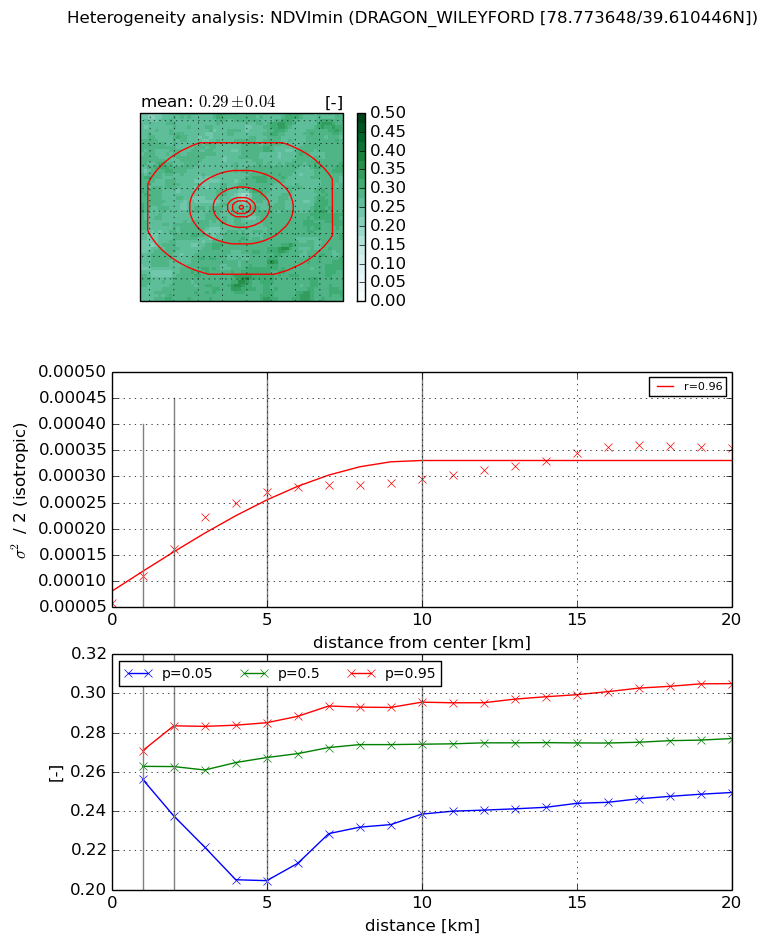
Heterogeneity analysis

The heterogeneity analysis provides information about the spatial and temporal heterogeneity of the site.

Topography


Roman et al. (2009) index


St

5.47413986977

Rcv

0.00972519920732

Rse

0.0

Rst

0.173583714965

Rsv

-0.364722387798


Height range @ 1km [m]

82

Height range @ 2km [m]

237

Height range @ 5km [m]

254

Height range @ 10km [m]

-999

Height range @ 20km [m]

-999


Variance slope @ 1 km

3560

Variance slope @ 2 km

3124

Variance slope @ 5 km

1293

Variance slope @ 10 km

-999

Variance slope @ 20 km

-999


NDVI (max. NDVI composite)


Roman et al. (2009) index


St

1.98612999417e-06

Rcv

0.0282943441286

Rse

0.0

Rst

0.390293058924

Rsv

1510474.73098


NDVI range @ 1km [-]

0.04

NDVI range @ 2km [-]

0.15

NDVI range @ 5km [-]

0.2

NDVI range @ 10km [-]

0.14

NDVI range @ 20km [-]

0.1


Variance slope @ 1 km

0.00018427250289

Variance slope @ 2 km

0.000192773782409

Variance slope @ 5 km

0.000191154294132

Variance slope @ 10 km

0.00011959473697

Variance slope @ 20 km

4.86244028775e-05


NDVI (min. NDVI composite)I


Roman et al. (2009) index


St

17.7967786629

Rcv

0.0891036474182

Rse

0.0

Rst

0.0593589037385

Rsv

-0.0201072814415


NDVI range @ 1km [-]

0.01

NDVI range @ 2km [-]

0.05

NDVI range @ 5km [-]

0.08

NDVI range @ 10km [-]

0.06

NDVI range @ 20km [-]

0.06


NDVI slope @ 1 km

5.13597037804e-05

NDVI slope @ 2 km

5.190641315e-05

NDVI slope @ 5 km

4.42306905924e-05

NDVI slope @ 10 km

2.20006109035e-05

NDVI slope @ 20 km

1.18660509245e-05


Temporal stability analysis

+000 deg (BHR)


BHR statistics

Temporal stability [1/decade]:


abs

rel


Weighted least square:

None


Ordinary least square:

None


Probabilities that GCOS criteria is met:

Weighted least square:

None %

Ordinary least square:

None %


DHR statistics

Temporal stability [1/decade]:


abs

rel


Weighted least square:

None


Ordinary least square:

None


Probabilities that GCOS criteria is met:

Weighted least square:

None %

Ordinary least square:

None %


+057/+063 deg (BHR)


BHR statistics

Temporal stability [1/decade]:


abs

rel


Weighted least square:

None


Ordinary least square:

None


Probabilities that GCOS criteria is met:

Weighted least square:

None %

Ordinary least square:

None %


DHR statistics

Temporal stability [1/decade]:


abs

rel


Weighted least square:

None


Ordinary least square:

None


Probabilities that GCOS criteria is met:

Weighted least square:

None %

Ordinary least square:

None %


Temporal anomaly analyis

The variance of the temporal anomalies provides an additional measure about the stability of the signal AFTER removal of the mean seasonal cylce.

+000 deg


+057/+063 deg