DRAGON_WSTFD


Location

lon / lat [deg]: -76.9462 / 39.3016

Source network: AERONET


Geostationary surface albedo (GSA) data


“+000”


“+057/+063”


Landcover information (based on ESA CCI landcover data)


Landcover fractions @ 2km distance


Landcover fractions @ 20 km distance


Legend


Distance to open water bodies [km]:

3.47

Distance to urban areas [km]:

0.04


Radius: 1 km

Number of landcover classes:

2

Dominant landcover type:

130: grassland

Fraction of dominant landcover type [%]:

98.0


Radius: 2 km

Number of landcover classes:

5

Dominant landcover type:

130: grassland

Fraction of dominant landcover type [%]:

83.0


Radius: 5 km

Number of landcover classes:

6

Dominant landcover type:

130: grassland

Fraction of dominant landcover type [%]:

76.0


Radius: 10 km

Number of landcover classes:

6

Dominant landcover type:

130: grassland

Fraction of dominant landcover type [%]:

66.0


Radius: 20 km

Number of landcover classes:

7

Dominant landcover type:

130: grassland

Fraction of dominant landcover type [%]:

53.0


Disturbances


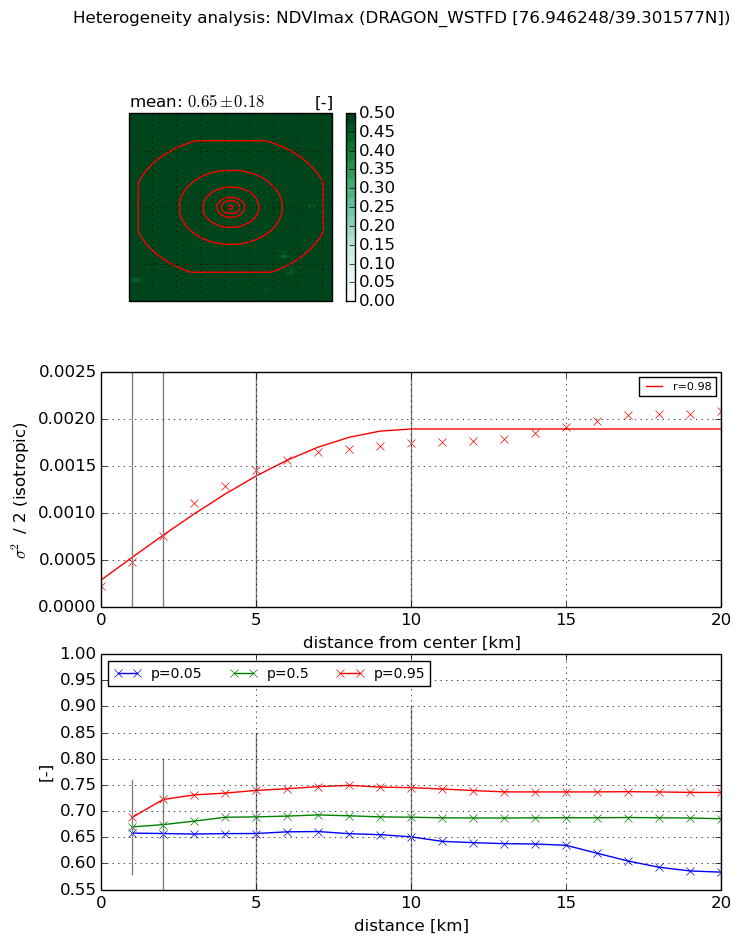
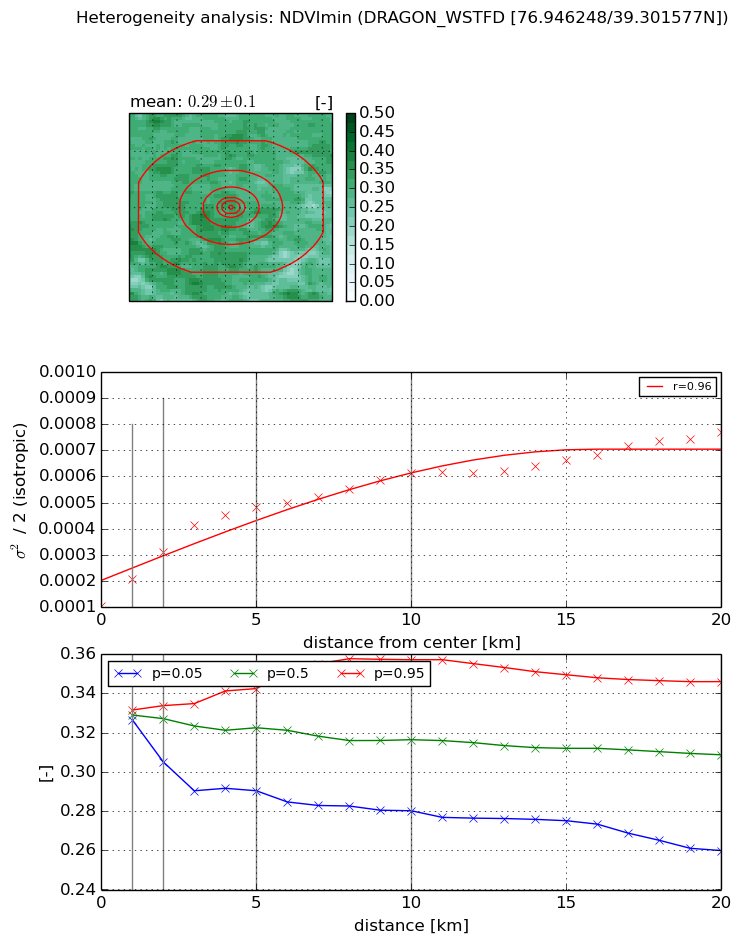
Heterogeneity analysis

The heterogeneity analysis provides information about the spatial and temporal heterogeneity of the site.

Topography


Roman et al. (2009) index


St

9.95273445315

Rcv

0.0732341955732

Rse

0.0

Rst

-0.0784478681307

Rsv

0.149742636626


Height range @ 1km [m]

36

Height range @ 2km [m]

59

Height range @ 5km [m]

62

Height range @ 10km [m]

-999

Height range @ 20km [m]

-999


Variance slope @ 1 km

132

Variance slope @ 2 km

95

Variance slope @ 5 km

78

Variance slope @ 10 km

-999

Variance slope @ 20 km

-999


NDVI (max. NDVI composite)


Roman et al. (2009) index


St

12.5877073178

Rcv

0.00891076930847

Rse

0.0

Rst

0.0147782439331

Rsv

0.214638739722


NDVI range @ 1km [-]

0.03

NDVI range @ 2km [-]

0.07

NDVI range @ 5km [-]

0.08

NDVI range @ 10km [-]

0.09

NDVI range @ 20km [-]

0.15


Variance slope @ 1 km

0.000251922993549

Variance slope @ 2 km

0.000264665337043

Variance slope @ 5 km

0.000254859474671

Variance slope @ 10 km

0.000151137798662

Variance slope @ 20 km

7.49513160227e-05


NDVI (min. NDVI composite)I


Roman et al. (2009) index


St

2.04056344761

Rcv

0.126280559874

Rse

0.0

Rst

-0.343903649936

Rsv

-0.99999796145


NDVI range @ 1km [-]

0.0

NDVI range @ 2km [-]

0.03

NDVI range @ 5km [-]

0.05

NDVI range @ 10km [-]

0.08

NDVI range @ 20km [-]

0.09


NDVI slope @ 1 km

0.000104537510757

NDVI slope @ 2 km

0.000103981211138

NDVI slope @ 5 km

7.80800042541e-05

NDVI slope @ 10 km

4.58581013086e-05

NDVI slope @ 20 km

2.63582825348e-05


Temporal stability analysis

+000 deg (BHR)


BHR statistics

Temporal stability [1/decade]:


abs

rel


Weighted least square:

-99999.0


Ordinary least square:

-99999.0


Probabilities that GCOS criteria is met:

Weighted least square:

-99999.0 %

Ordinary least square:

-99999.0 %


DHR statistics

Temporal stability [1/decade]:


abs

rel


Weighted least square:

-99999.0


Ordinary least square:

-99999.0


Probabilities that GCOS criteria is met:

Weighted least square:

-99999.0 %

Ordinary least square:

-99999.0 %


+057/+063 deg (BHR)


BHR statistics

Temporal stability [1/decade]:


abs

rel


Weighted least square:

None


Ordinary least square:

None


Probabilities that GCOS criteria is met:

Weighted least square:

None %

Ordinary least square:

None %


DHR statistics

Temporal stability [1/decade]:


abs

rel


Weighted least square:

None


Ordinary least square:

None


Probabilities that GCOS criteria is met:

Weighted least square:

None %

Ordinary least square:

None %


Temporal anomaly analyis

The variance of the temporal anomalies provides an additional measure about the stability of the signal AFTER removal of the mean seasonal cylce.

+000 deg


+057/+063 deg