DRA


Location

lon / lat [deg]: -116.018 / 36.626

Source network: BSRN


Geostationary surface albedo (GSA) data


“+000”


“+057/+063”


Landcover information (based on ESA CCI landcover data)


Landcover fractions @ 2km distance


Landcover fractions @ 20 km distance


Legend


Distance to open water bodies [km]:

23.84

Distance to urban areas [km]:

0.04


Radius: 1 km

Number of landcover classes:

2

Dominant landcover type:

120: Shrubland

Fraction of dominant landcover type [%]:

56.0


Radius: 2 km

Number of landcover classes:

2

Dominant landcover type:

120: Shrubland

Fraction of dominant landcover type [%]:

85.0


Radius: 5 km

Number of landcover classes:

2

Dominant landcover type:

120: Shrubland

Fraction of dominant landcover type [%]:

94.0


Radius: 10 km

Number of landcover classes:

2

Dominant landcover type:

120: Shrubland

Fraction of dominant landcover type [%]:

98.0


Radius: 20 km

Number of landcover classes:

1

Dominant landcover type:

120: Shrubland

Fraction of dominant landcover type [%]:

98.0


Disturbances


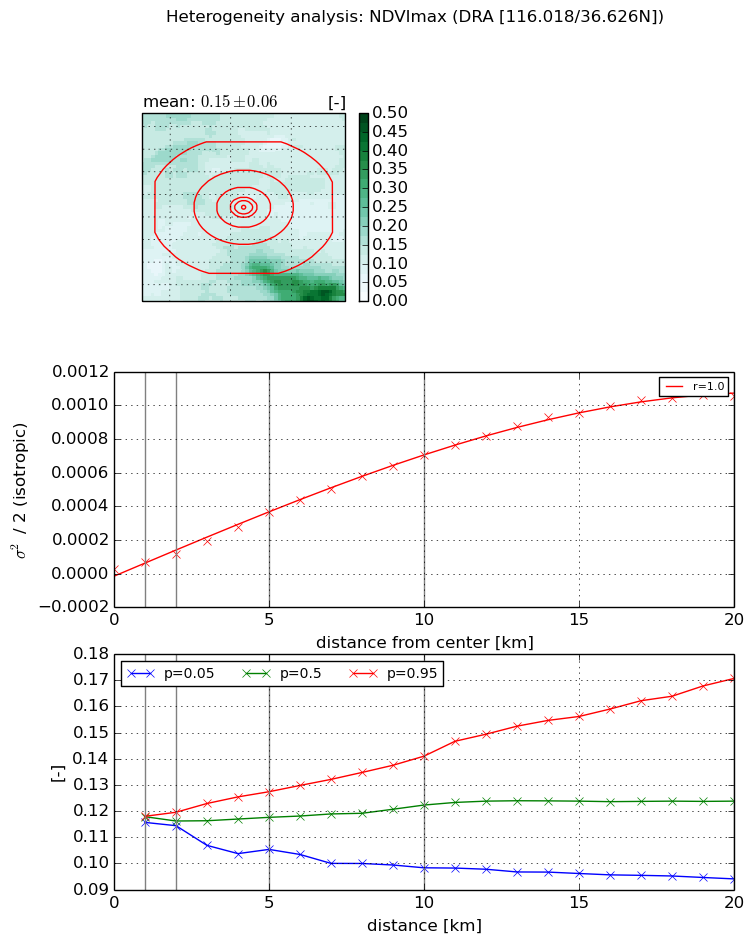
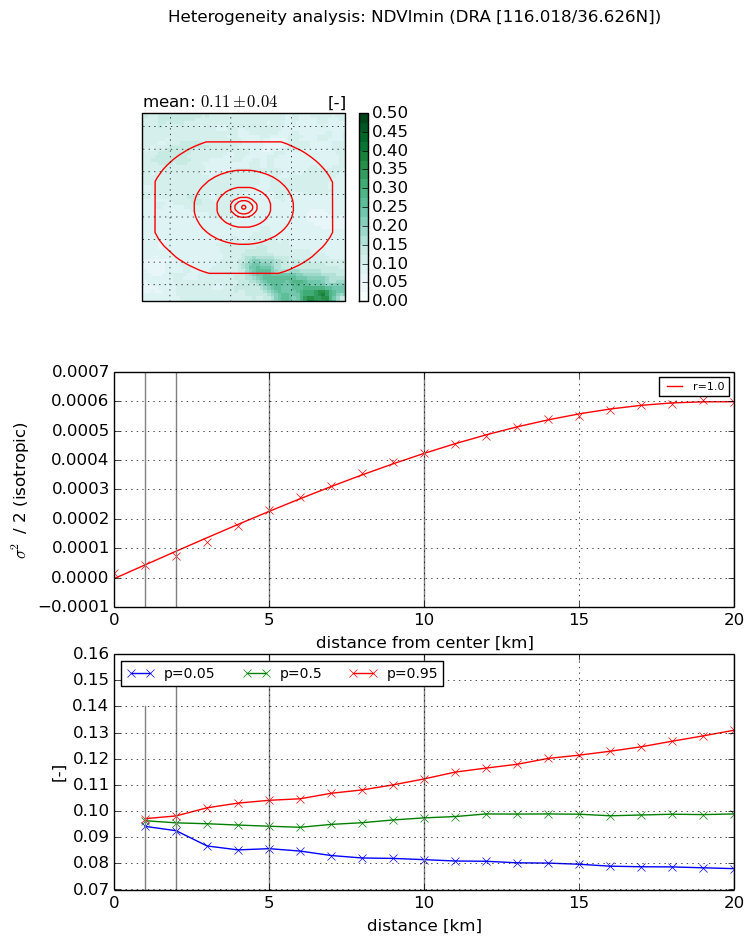
Heterogeneity analysis

The heterogeneity analysis provides information about the spatial and temporal heterogeneity of the site.

Topography


Roman et al. (2009) index


St

1.76984492418

Rcv

0.7138873271

Rse

0.0

Rst

-8.98661720226e-05

Rsv

-0.981086571364


Height range @ 1km [m]

45

Height range @ 2km [m]

94

Height range @ 5km [m]

246

Height range @ 10km [m]

-999

Height range @ 20km [m]

-999


Variance slope @ 1 km

726

Variance slope @ 2 km

985

Variance slope @ 5 km

1495

Variance slope @ 10 km

-999

Variance slope @ 20 km

-999


NDVI (max. NDVI composite)


Roman et al. (2009) index


St

0.61644037729

Rcv

0.483280016241

Rse

0.0

Rst

1.74446946824e-08

Rsv

4.38337067662


NDVI range @ 1km [-]

0.0

NDVI range @ 2km [-]

0.01

NDVI range @ 5km [-]

0.02

NDVI range @ 10km [-]

0.04

NDVI range @ 20km [-]

0.08


Variance slope @ 1 km

3.89974194806e-05

Variance slope @ 2 km

4.52675151576e-05

Variance slope @ 5 km

6.87668067026e-05

Variance slope @ 10 km

7.11075978283e-05

Variance slope @ 20 km

5.64856429993e-05


NDVI (min. NDVI composite)I


Roman et al. (2009) index


St

1.31277906899

Rcv

0.411591169607

Rse

0.0

Rst

1.10366735289e-09

Rsv

1.87363722063


NDVI range @ 1km [-]

0.0

NDVI range @ 2km [-]

0.01

NDVI range @ 5km [-]

0.02

NDVI range @ 10km [-]

0.03

NDVI range @ 20km [-]

0.05


NDVI slope @ 1 km

2.44057528608e-05

NDVI slope @ 2 km

2.83264785065e-05

NDVI slope @ 5 km

4.32811465614e-05

NDVI slope @ 10 km

4.33276907619e-05

NDVI slope @ 20 km

3.14538722976e-05


Temporal stability analysis

+000 deg (BHR)


BHR statistics

Temporal stability [1/decade]:


abs

rel


Weighted least square:

None


Ordinary least square:

None


Probabilities that GCOS criteria is met:

Weighted least square:

None %

Ordinary least square:

None %


DHR statistics

Temporal stability [1/decade]:


abs

rel


Weighted least square:

None


Ordinary least square:

None


Probabilities that GCOS criteria is met:

Weighted least square:

None %

Ordinary least square:

None %


+057/+063 deg (BHR)


BHR statistics

Temporal stability [1/decade]:


abs

rel


Weighted least square:

None


Ordinary least square:

None


Probabilities that GCOS criteria is met:

Weighted least square:

None %

Ordinary least square:

None %


DHR statistics

Temporal stability [1/decade]:


abs

rel


Weighted least square:

None


Ordinary least square:

None


Probabilities that GCOS criteria is met:

Weighted least square:

None %

Ordinary least square:

None %


Temporal anomaly analyis

The variance of the temporal anomalies provides an additional measure about the stability of the signal AFTER removal of the mean seasonal cylce.

+000 deg


+057/+063 deg