DUNHUANG_LZU


Location

lon / lat [deg]: 94.955 / 40.4924

Source network: AERONET


Geostationary surface albedo (GSA) data


“+000”


“+057/+063”


Landcover information (based on ESA CCI landcover data)


Landcover fractions @ 2km distance


Landcover fractions @ 20 km distance


Legend


Distance to open water bodies [km]:

35.25

Distance to urban areas [km]:

29.04


Radius: 1 km

Number of landcover classes:

4

Dominant landcover type:

130: grassland

Fraction of dominant landcover type [%]:

66.0


Radius: 2 km

Number of landcover classes:

6

Dominant landcover type:

130: grassland

Fraction of dominant landcover type [%]:

42.0


Radius: 5 km

Number of landcover classes:

8

Dominant landcover type:

200: bare areas

Fraction of dominant landcover type [%]:

38.0


Radius: 10 km

Number of landcover classes:

7

Dominant landcover type:

200: bare areas

Fraction of dominant landcover type [%]:

42.0


Radius: 20 km

Number of landcover classes:

5

Dominant landcover type:

200: bare areas

Fraction of dominant landcover type [%]:

57.0


Disturbances


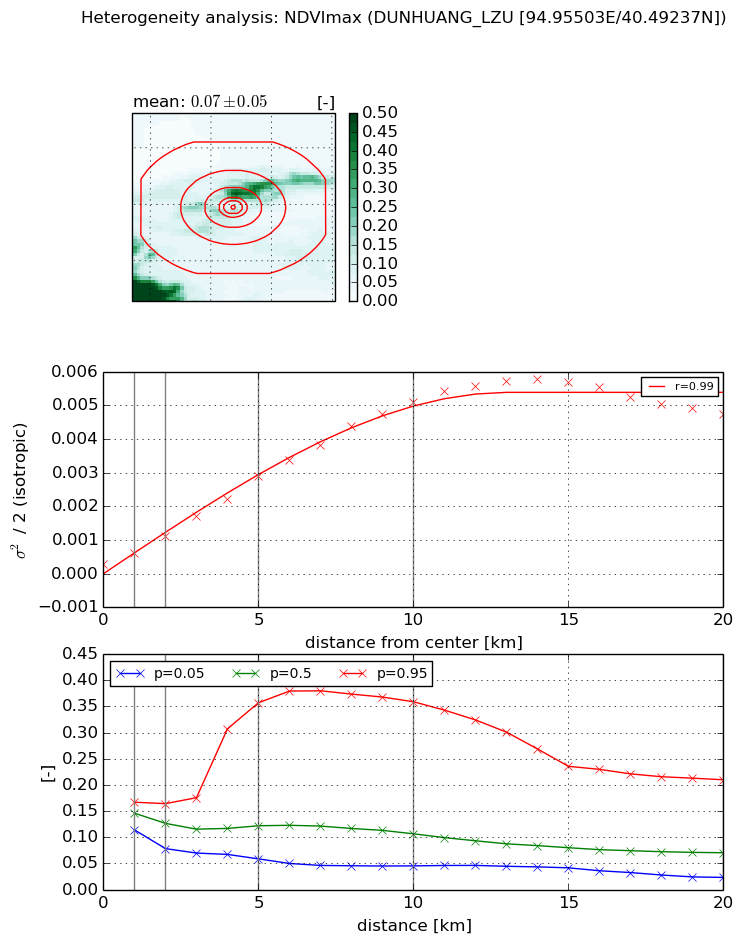
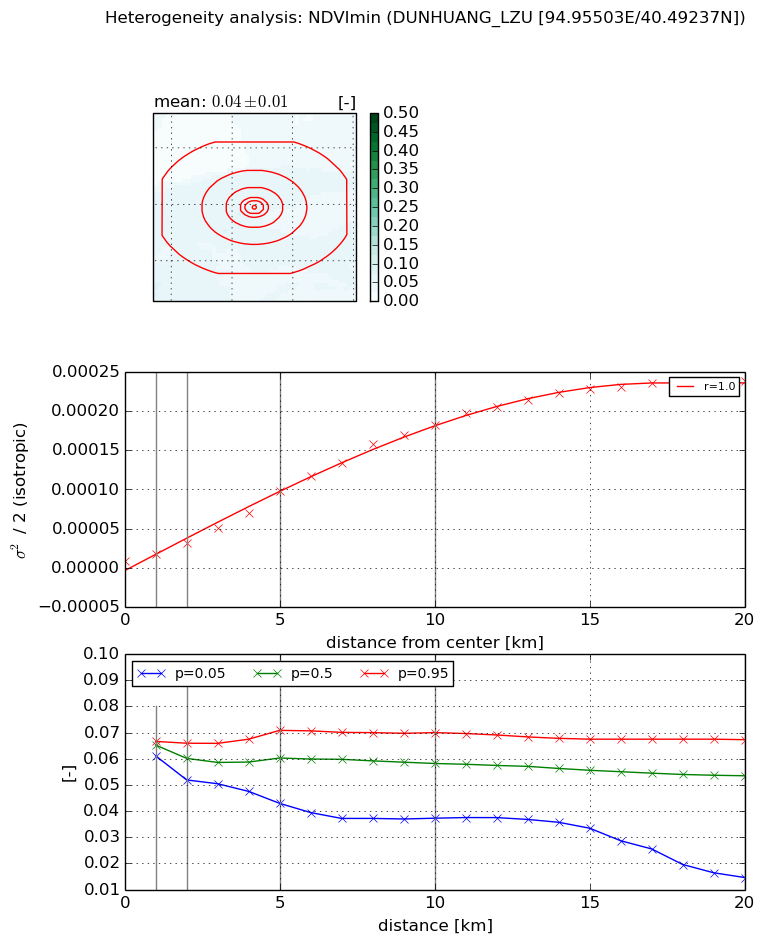
Heterogeneity analysis

The heterogeneity analysis provides information about the spatial and temporal heterogeneity of the site.

Topography


Roman et al. (2009) index


St

0.209153041066

Rcv

0.32023692875

Rse

0.0

Rst

9.30067799925e-09

Rsv

14.023326917


Height range @ 1km [m]

4

Height range @ 2km [m]

6

Height range @ 5km [m]

9

Height range @ 10km [m]

-999

Height range @ 20km [m]

-999


Variance slope @ 1 km

0

Variance slope @ 2 km

0

Variance slope @ 5 km

1

Variance slope @ 10 km

-999

Variance slope @ 20 km

-999


NDVI (max. NDVI composite)


Roman et al. (2009) index


St

0.415125552926

Rcv

1.2314758772

Rse

0.0

Rst

-0.45903648025

Rsv

5.53621695096


NDVI range @ 1km [-]

0.05

NDVI range @ 2km [-]

0.09

NDVI range @ 5km [-]

0.3

NDVI range @ 10km [-]

0.31

NDVI range @ 20km [-]

0.19


Variance slope @ 1 km

0.000326023504935

Variance slope @ 2 km

0.000406775798682

Variance slope @ 5 km

0.000524693911255

Variance slope @ 10 km

0.00050719042391

Variance slope @ 20 km

0.000249255292898


NDVI (min. NDVI composite)I


Roman et al. (2009) index


St

1.5466910468

Rcv

0.59053294293

Rse

0.0

Rst

-0.349092274497

Rsv

-0.999999380653


NDVI range @ 1km [-]

0.01

NDVI range @ 2km [-]

0.01

NDVI range @ 5km [-]

0.03

NDVI range @ 10km [-]

0.03

NDVI range @ 20km [-]

0.05


NDVI slope @ 1 km

9.02542325883e-06

NDVI slope @ 2 km

1.16897704398e-05

NDVI slope @ 5 km

1.79139618579e-05

NDVI slope @ 10 km

1.88325244799e-05

NDVI slope @ 20 km

1.24735928421e-05


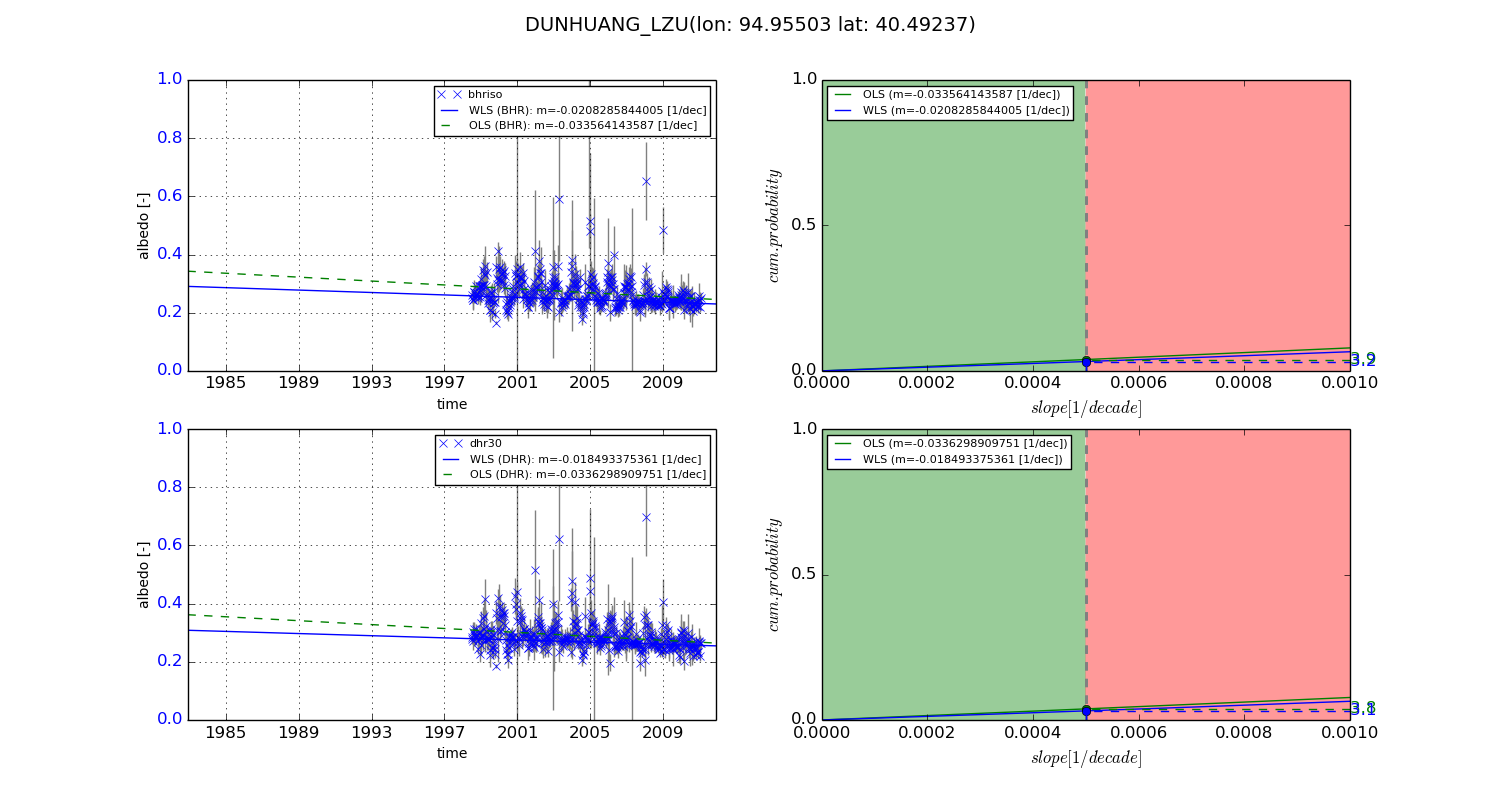
Temporal stability analysis

+000 deg (BHR)


BHR statistics

Temporal stability [1/decade]:


abs

rel


Weighted least square:

None


Ordinary least square:

None


Probabilities that GCOS criteria is met:

Weighted least square:

None %

Ordinary least square:

None %


DHR statistics

Temporal stability [1/decade]:


abs

rel


Weighted least square:

None


Ordinary least square:

None


Probabilities that GCOS criteria is met:

Weighted least square:

None %

Ordinary least square:

None %


+057/+063 deg (BHR)


BHR statistics

Temporal stability [1/decade]:


abs

rel


Weighted least square:

-0.0208285844005


Ordinary least square:

-0.033564143587


Probabilities that GCOS criteria is met:

Weighted least square:

3.2 %

Ordinary least square:

3.9 %


DHR statistics

Temporal stability [1/decade]:


abs

rel


Weighted least square:

-0.018493375361


Ordinary least square:

-0.0336298909751


Probabilities that GCOS criteria is met:

Weighted least square:

3.1 %

Ordinary least square:

3.8 %


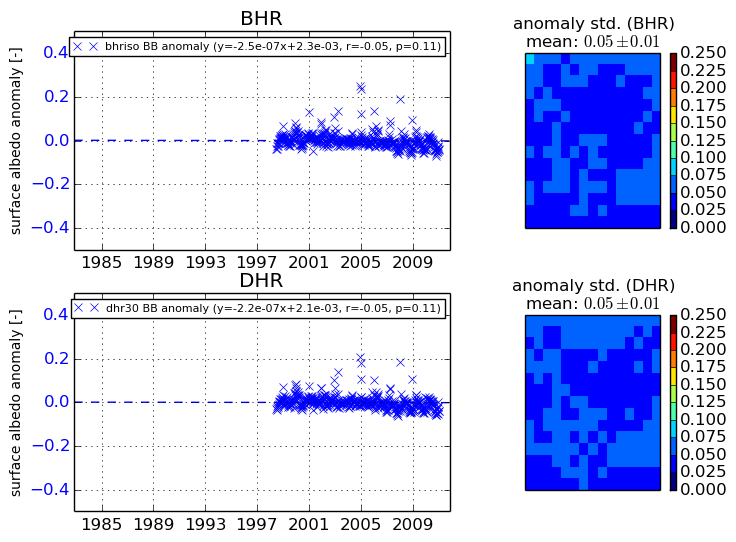
Temporal anomaly analyis

The variance of the temporal anomalies provides an additional measure about the stability of the signal AFTER removal of the mean seasonal cylce.

+000 deg


+057/+063 deg