DUNHUANG


Location

lon / lat [deg]: 94.794 / 40.0384

Source network: AERONET


Geostationary surface albedo (GSA) data


“+000”


“+057/+063”


Landcover information (based on ESA CCI landcover data)


Landcover fractions @ 2km distance


Landcover fractions @ 20 km distance


Legend


Distance to open water bodies [km]:

19.64

Distance to urban areas [km]:

13.0


Radius: 1 km

Number of landcover classes:

3

Dominant landcover type:

200: bare areas

Fraction of dominant landcover type [%]:

67.0


Radius: 2 km

Number of landcover classes:

3

Dominant landcover type:

200: bare areas

Fraction of dominant landcover type [%]:

61.0


Radius: 5 km

Number of landcover classes:

2

Dominant landcover type:

200: bare areas

Fraction of dominant landcover type [%]:

52.0


Radius: 10 km

Number of landcover classes:

4

Dominant landcover type:

130: grassland

Fraction of dominant landcover type [%]:

50.0


Radius: 20 km

Number of landcover classes:

7

Dominant landcover type:

200: bare areas

Fraction of dominant landcover type [%]:

44.0


Disturbances


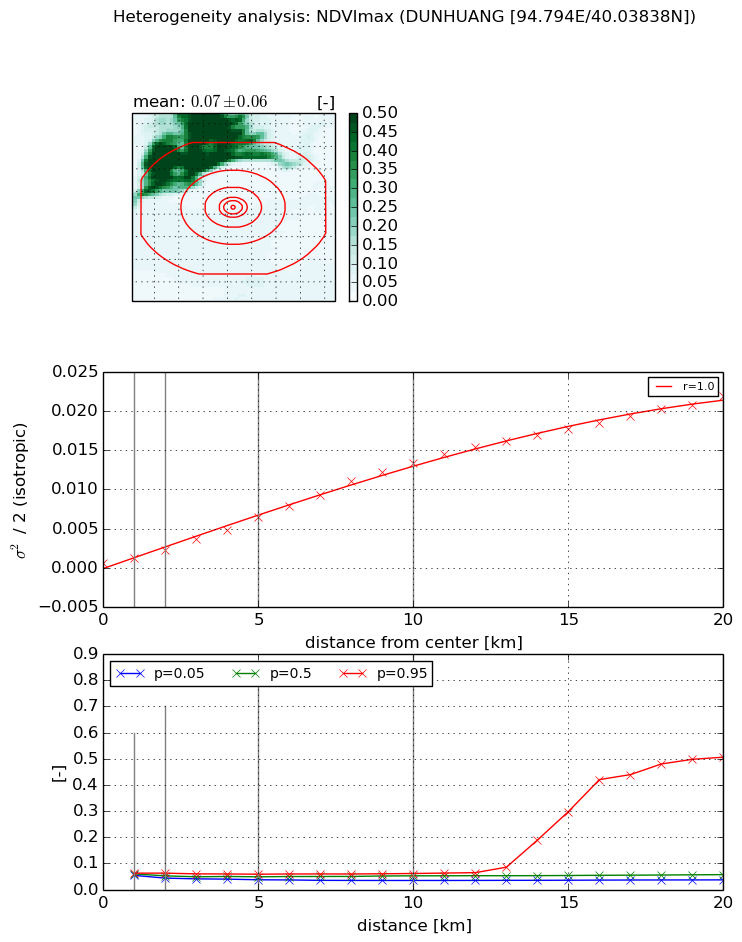
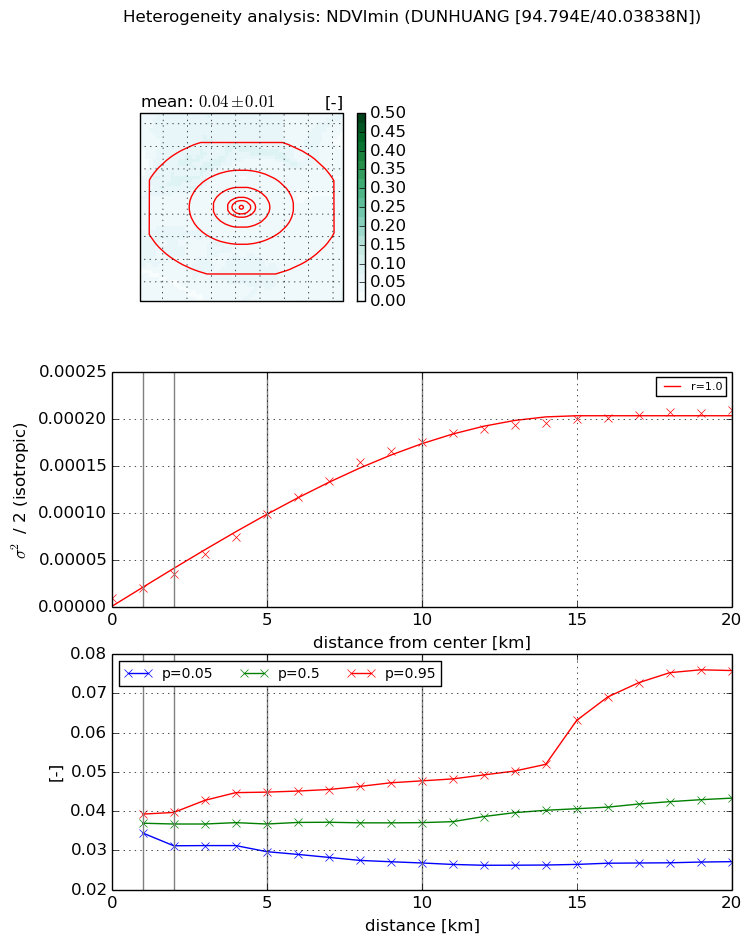
Heterogeneity analysis

The heterogeneity analysis provides information about the spatial and temporal heterogeneity of the site.

Topography


Roman et al. (2009) index


St

2.95789384555

Rcv

0.523527367842

Rse

0.0

Rst

-9.50693851985e-08

Rsv

-0.490707718151


Height range @ 1km [m]

68

Height range @ 2km [m]

182

Height range @ 5km [m]

329

Height range @ 10km [m]

-999

Height range @ 20km [m]

-999


Variance slope @ 1 km

1230

Variance slope @ 2 km

1533

Variance slope @ 5 km

2418

Variance slope @ 10 km

-999

Variance slope @ 20 km

-999


NDVI (max. NDVI composite)


Roman et al. (2009) index


St

1.66338458537

Rcv

0.118490033271

Rse

0.0

Rst

-0.27706001618

Rsv

1.40800159242


NDVI range @ 1km [-]

0.01

NDVI range @ 2km [-]

0.02

NDVI range @ 5km [-]

0.02

NDVI range @ 10km [-]

0.03

NDVI range @ 20km [-]

0.47


Variance slope @ 1 km

0.000690341024988

Variance slope @ 2 km

0.000857705933782

Variance slope @ 5 km

0.0011983223053

Variance slope @ 10 km

0.00134460163322

Variance slope @ 20 km

0.00109937741529


NDVI (min. NDVI composite)I


Roman et al. (2009) index


St

5.64334685692

Rcv

0.356714240595

Rse

0.0

Rst

-0.0978232959049

Rsv

-0.0770618983858


NDVI range @ 1km [-]

0.0

NDVI range @ 2km [-]

0.01

NDVI range @ 5km [-]

0.02

NDVI range @ 10km [-]

0.02

NDVI range @ 20km [-]

0.05


NDVI slope @ 1 km

1.05505108926e-05

NDVI slope @ 2 km

1.28841419446e-05

NDVI slope @ 5 km

1.79623865402e-05

NDVI slope @ 10 km

1.78773555429e-05

NDVI slope @ 20 km

1.02975285936e-05


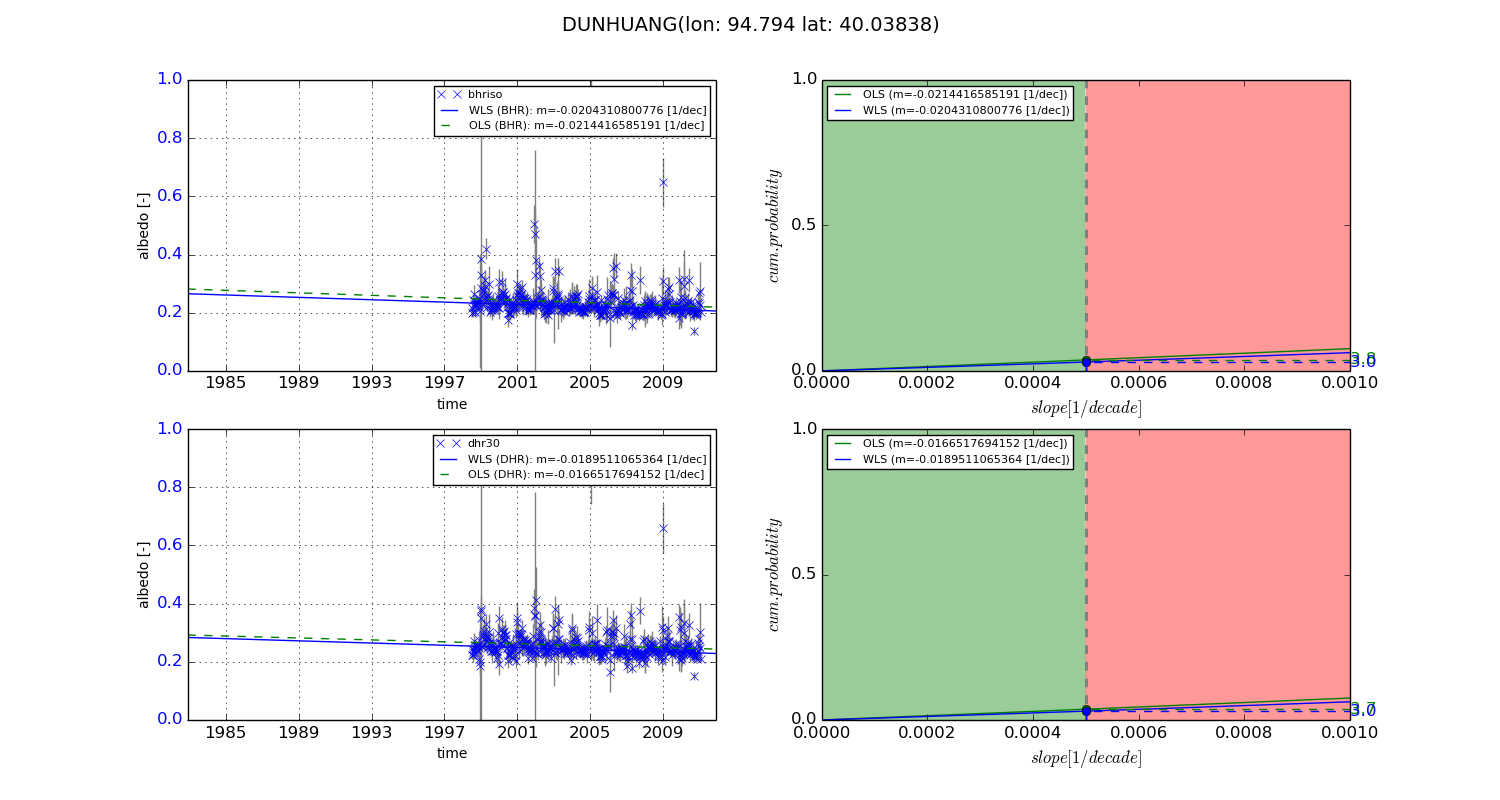
Temporal stability analysis

+000 deg (BHR)


BHR statistics

Temporal stability [1/decade]:


abs

rel


Weighted least square:

None


Ordinary least square:

None


Probabilities that GCOS criteria is met:

Weighted least square:

None %

Ordinary least square:

None %


DHR statistics

Temporal stability [1/decade]:


abs

rel


Weighted least square:

None


Ordinary least square:

None


Probabilities that GCOS criteria is met:

Weighted least square:

None %

Ordinary least square:

None %


+057/+063 deg (BHR)


BHR statistics

Temporal stability [1/decade]:


abs

rel


Weighted least square:

-0.0204310800776


Ordinary least square:

-0.0214416585191


Probabilities that GCOS criteria is met:

Weighted least square:

3.0 %

Ordinary least square:

3.8 %


DHR statistics

Temporal stability [1/decade]:


abs

rel


Weighted least square:

-0.0189511065364


Ordinary least square:

-0.0166517694152


Probabilities that GCOS criteria is met:

Weighted least square:

3.0 %

Ordinary least square:

3.7 %


Temporal anomaly analyis

The variance of the temporal anomalies provides an additional measure about the stability of the signal AFTER removal of the mean seasonal cylce.

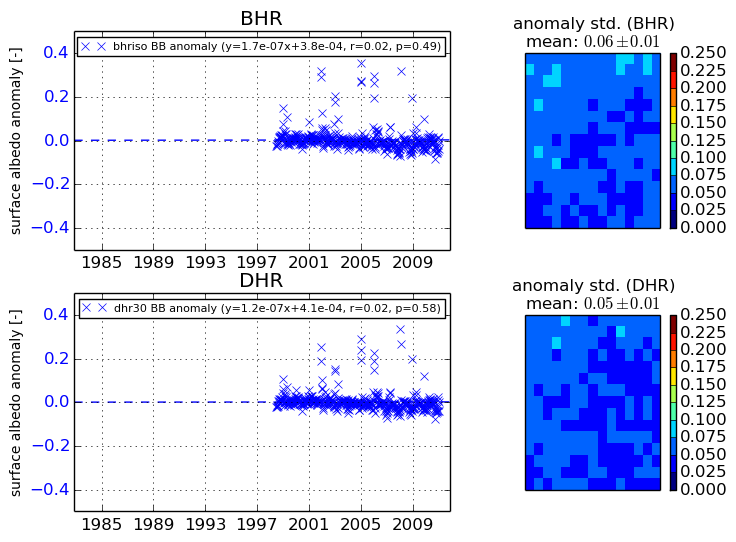
+000 deg


+057/+063 deg