DUSHANBE


Location

lon / lat [deg]: 68.8579 / 38.5533

Source network: AERONET


Geostationary surface albedo (GSA) data


“+000”


“+057/+063”


Landcover information (based on ESA CCI landcover data)


Landcover fractions @ 2km distance


Landcover fractions @ 20 km distance


Legend


Distance to open water bodies [km]:

8.24

Distance to urban areas [km]:

0.13


Radius: 1 km

Number of landcover classes:

2

Dominant landcover type:

190: urban areas

Fraction of dominant landcover type [%]:

98.0


Radius: 2 km

Number of landcover classes:

3

Dominant landcover type:

190: urban areas

Fraction of dominant landcover type [%]:

76.0


Radius: 5 km

Number of landcover classes:

4

Dominant landcover type:

190: urban areas

Fraction of dominant landcover type [%]:

53.0


Radius: 10 km

Number of landcover classes:

4

Dominant landcover type:

190: urban areas

Fraction of dominant landcover type [%]:

39.0


Radius: 20 km

Number of landcover classes:

6

Dominant landcover type:

10: cropland, rainfed

Fraction of dominant landcover type [%]:

38.0


Disturbances


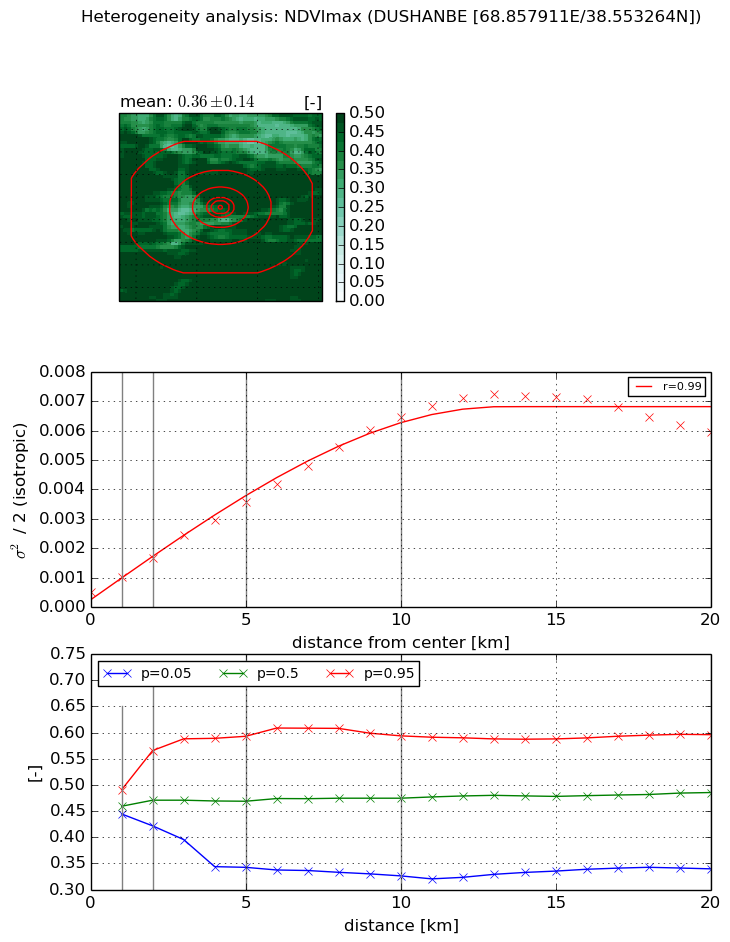
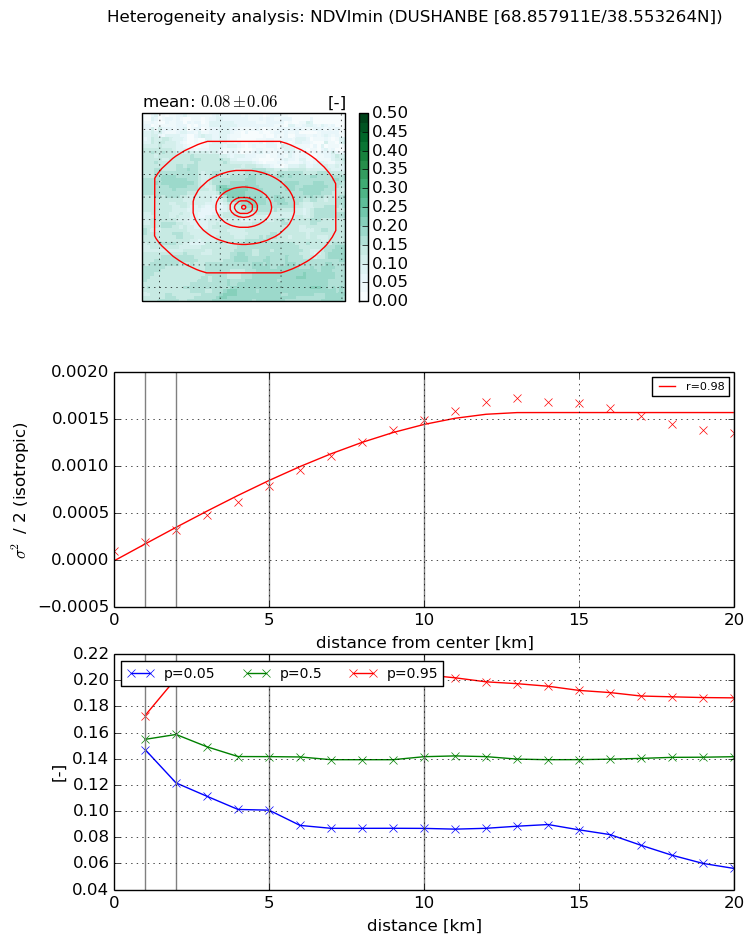
Heterogeneity analysis

The heterogeneity analysis provides information about the spatial and temporal heterogeneity of the site.

Topography


Roman et al. (2009) index


St

1.40633827412

Rcv

0.424171059936

Rse

0.0

Rst

1.16314809349e-06

Rsv

1.70902720355


Height range @ 1km [m]

83

Height range @ 2km [m]

128

Height range @ 5km [m]

235

Height range @ 10km [m]

-999

Height range @ 20km [m]

-999


Variance slope @ 1 km

567

Variance slope @ 2 km

735

Variance slope @ 5 km

1294

Variance slope @ 10 km

-999

Variance slope @ 20 km

-999


NDVI (max. NDVI composite)


Roman et al. (2009) index


St

5.56482922617e-06

Rcv

0.3954793676

Rse

0.0

Rst

0.0767572203738

Rsv

539099.629146


NDVI range @ 1km [-]

0.05

NDVI range @ 2km [-]

0.14

NDVI range @ 5km [-]

0.25

NDVI range @ 10km [-]

0.27

NDVI range @ 20km [-]

0.26


Variance slope @ 1 km

0.000528021239678

Variance slope @ 2 km

0.00058460704372

Variance slope @ 5 km

0.000627498304186

Variance slope @ 10 km

0.000608793566207

Variance slope @ 20 km

0.000305941540525


NDVI (min. NDVI composite)I


Roman et al. (2009) index


St

0.768256370099

Rcv

0.213387123027

Rse

0.0

Rst

0.132679196844

Rsv

3.55888014951


NDVI range @ 1km [-]

0.03

NDVI range @ 2km [-]

0.08

NDVI range @ 5km [-]

0.11

NDVI range @ 10km [-]

0.12

NDVI range @ 20km [-]

0.13


NDVI slope @ 1 km

9.3942383578e-05

NDVI slope @ 2 km

0.000109232385211

NDVI slope @ 5 km

0.00014053343897

NDVI slope @ 10 km

0.000146702451602

NDVI slope @ 20 km

7.2397380245e-05


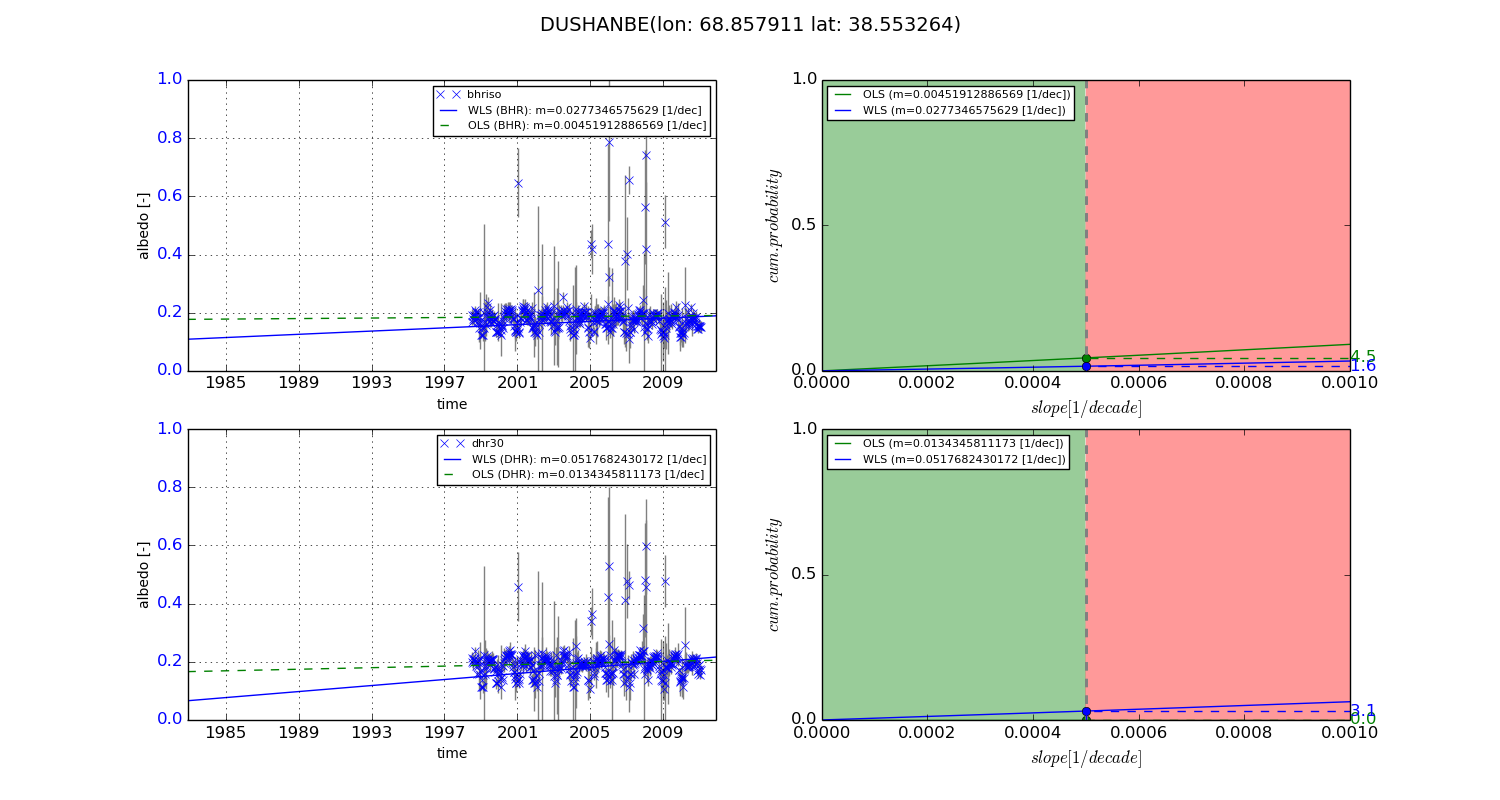
Temporal stability analysis

+000 deg (BHR)


BHR statistics

Temporal stability [1/decade]:


abs

rel


Weighted least square:

-99999.0


Ordinary least square:

-99999.0


Probabilities that GCOS criteria is met:

Weighted least square:

-99999.0 %

Ordinary least square:

-99999.0 %


DHR statistics

Temporal stability [1/decade]:


abs

rel


Weighted least square:

-99999.0


Ordinary least square:

-99999.0


Probabilities that GCOS criteria is met:

Weighted least square:

-99999.0 %

Ordinary least square:

-99999.0 %


+057/+063 deg (BHR)


BHR statistics

Temporal stability [1/decade]:


abs

rel


Weighted least square:

0.0277346575629


Ordinary least square:

0.00451912886569


Probabilities that GCOS criteria is met:

Weighted least square:

1.6 %

Ordinary least square:

4.5 %


DHR statistics

Temporal stability [1/decade]:


abs

rel


Weighted least square:

0.0517682430172


Ordinary least square:

0.0134345811173


Probabilities that GCOS criteria is met:

Weighted least square:

3.1 %

Ordinary least square:

0.0 %


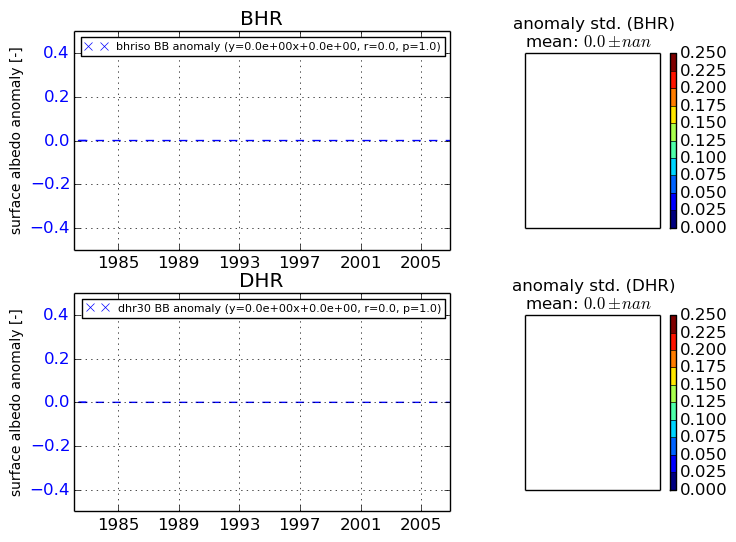
Temporal anomaly analyis

The variance of the temporal anomalies provides an additional measure about the stability of the signal AFTER removal of the mean seasonal cylce.
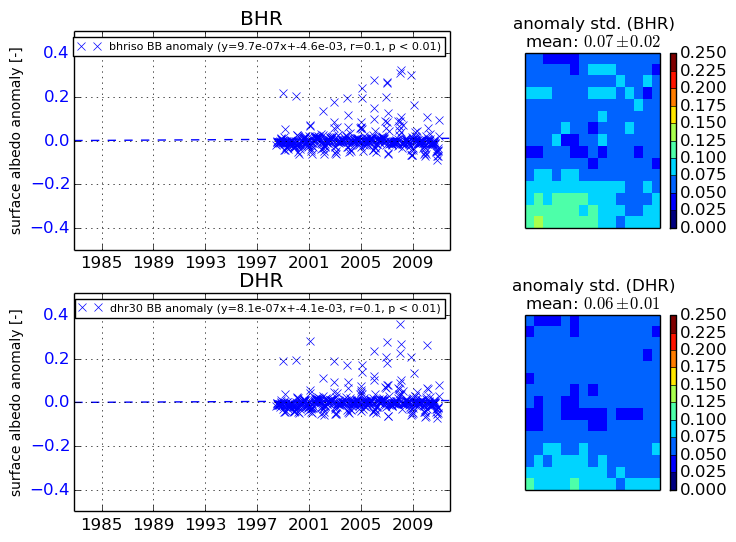
+000 deg


+057/+063 deg