EGBERT


Location

lon / lat [deg]: -79.75 / 44.2257

Source network: AERONET


Geostationary surface albedo (GSA) data


“+000”


“+057/+063”


Landcover information (based on ESA CCI landcover data)


Landcover fractions @ 2km distance


Landcover fractions @ 20 km distance


Legend


Distance to open water bodies [km]:

15.08

Distance to urban areas [km]:

5.01


Radius: 1 km

Number of landcover classes:

3

Dominant landcover type:

10: cropland, rainfed

Fraction of dominant landcover type [%]:

79.0


Radius: 2 km

Number of landcover classes:

5

Dominant landcover type:

10: cropland, rainfed

Fraction of dominant landcover type [%]:

73.0


Radius: 5 km

Number of landcover classes:

5

Dominant landcover type:

10: cropland, rainfed

Fraction of dominant landcover type [%]:

60.0


Radius: 10 km

Number of landcover classes:

5

Dominant landcover type:

10: cropland, rainfed

Fraction of dominant landcover type [%]:

57.0


Radius: 20 km

Number of landcover classes:

9

Dominant landcover type:

10: cropland, rainfed

Fraction of dominant landcover type [%]:

45.0


Disturbances


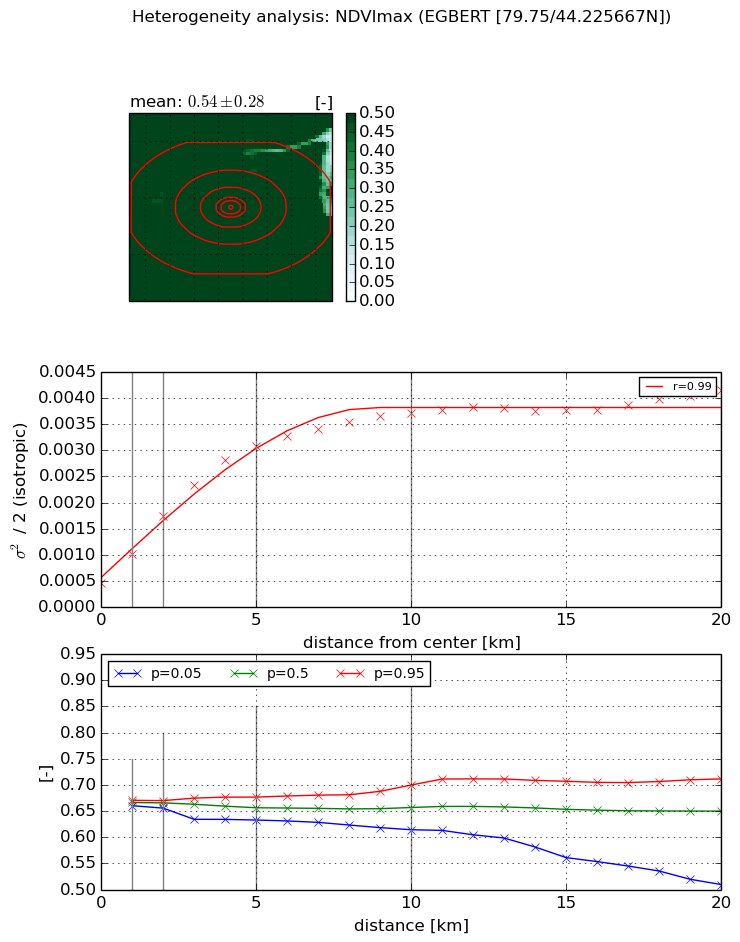
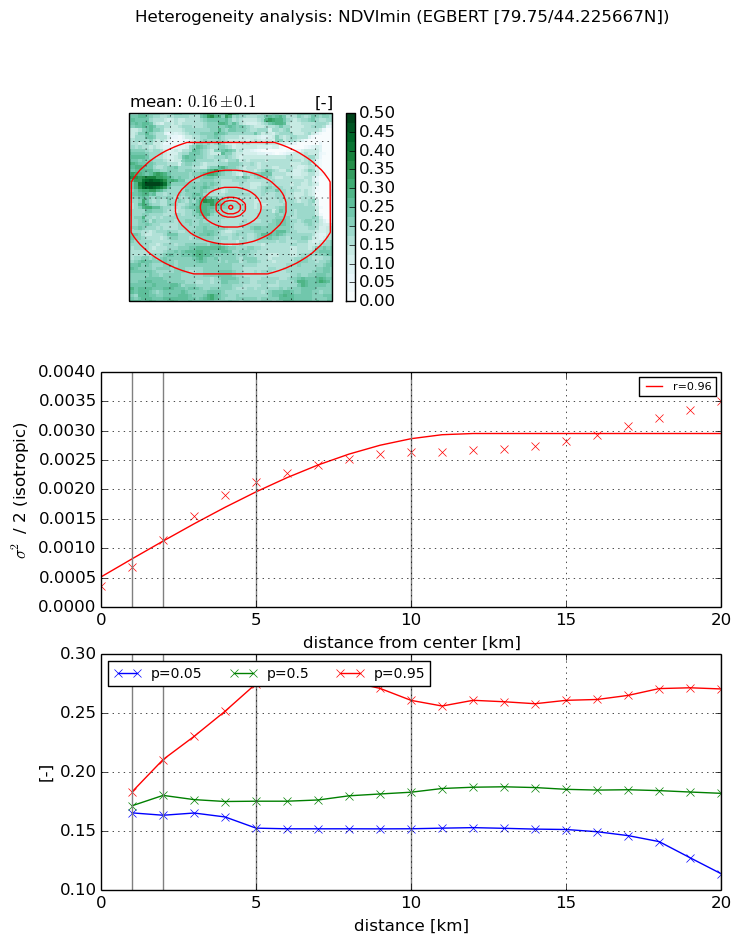
Heterogeneity analysis

The heterogeneity analysis provides information about the spatial and temporal heterogeneity of the site.

Topography


Roman et al. (2009) index


St

0.000490186306025

Rcv

0.436083242984

Rse

0.0

Rst

0.06217031512

Rsv

6119.62375541


Height range @ 1km [m]

20

Height range @ 2km [m]

42

Height range @ 5km [m]

74

Height range @ 10km [m]

-999

Height range @ 20km [m]

-999


Variance slope @ 1 km

97

Variance slope @ 2 km

128

Variance slope @ 5 km

143

Variance slope @ 10 km

-999

Variance slope @ 20 km

-999


NDVI (max. NDVI composite)


Roman et al. (2009) index


St

5.69031809447e-07

Rcv

0.223408729791

Rse

0.0

Rst

0.0476627871284

Rsv

5272112.72893


NDVI range @ 1km [-]

0.01

NDVI range @ 2km [-]

0.01

NDVI range @ 5km [-]

0.04

NDVI range @ 10km [-]

0.09

NDVI range @ 20km [-]

0.2


Variance slope @ 1 km

0.000543037627954

Variance slope @ 2 km

0.000634363235078

Variance slope @ 5 km

0.000545254276853

Variance slope @ 10 km

0.000316577687745

Variance slope @ 20 km

0.000137473331643


NDVI (min. NDVI composite)I


Roman et al. (2009) index


St

1.51966963375

Rcv

0.736453402728

Rse

0.0

Rst

-0.237660336276

Rsv

-0.999999537572


NDVI range @ 1km [-]

0.02

NDVI range @ 2km [-]

0.05

NDVI range @ 5km [-]

0.12

NDVI range @ 10km [-]

0.11

NDVI range @ 20km [-]

0.16


NDVI slope @ 1 km

0.000326764147801

NDVI slope @ 2 km

0.000394939521861

NDVI slope @ 5 km

0.000368422823035

NDVI slope @ 10 km

0.000229354041683

NDVI slope @ 20 km

0.000123582023742


Temporal stability analysis

+000 deg (BHR)


BHR statistics

Temporal stability [1/decade]:


abs

rel


Weighted least square:

None


Ordinary least square:

None


Probabilities that GCOS criteria is met:

Weighted least square:

None %

Ordinary least square:

None %


DHR statistics

Temporal stability [1/decade]:


abs

rel


Weighted least square:

None


Ordinary least square:

None


Probabilities that GCOS criteria is met:

Weighted least square:

None %

Ordinary least square:

None %


+057/+063 deg (BHR)


BHR statistics

Temporal stability [1/decade]:


abs

rel


Weighted least square:

None


Ordinary least square:

None


Probabilities that GCOS criteria is met:

Weighted least square:

None %

Ordinary least square:

None %


DHR statistics

Temporal stability [1/decade]:


abs

rel


Weighted least square:

None


Ordinary least square:

None


Probabilities that GCOS criteria is met:

Weighted least square:

None %

Ordinary least square:

None %


Temporal anomaly analyis

The variance of the temporal anomalies provides an additional measure about the stability of the signal AFTER removal of the mean seasonal cylce.

+000 deg


+057/+063 deg