ELANDSFONTEIN


Location

lon / lat [deg]: 29.4176 / -26.2453

Source network: AERONET


Geostationary surface albedo (GSA) data


“+000”


“+057/+063”


Landcover information (based on ESA CCI landcover data)


Landcover fractions @ 2km distance


Landcover fractions @ 20 km distance


Legend


Distance to open water bodies [km]:

2.11

Distance to urban areas [km]:

10.26


Radius: 1 km

Number of landcover classes:

4

Dominant landcover type:

130: grassland

Fraction of dominant landcover type [%]:

69.0


Radius: 2 km

Number of landcover classes:

4

Dominant landcover type:

10: cropland, rainfed

Fraction of dominant landcover type [%]:

53.0


Radius: 5 km

Number of landcover classes:

3

Dominant landcover type:

10: cropland, rainfed

Fraction of dominant landcover type [%]:

78.0


Radius: 10 km

Number of landcover classes:

4

Dominant landcover type:

10: cropland, rainfed

Fraction of dominant landcover type [%]:

87.0


Radius: 20 km

Number of landcover classes:

5

Dominant landcover type:

10: cropland, rainfed

Fraction of dominant landcover type [%]:

89.0


Disturbances


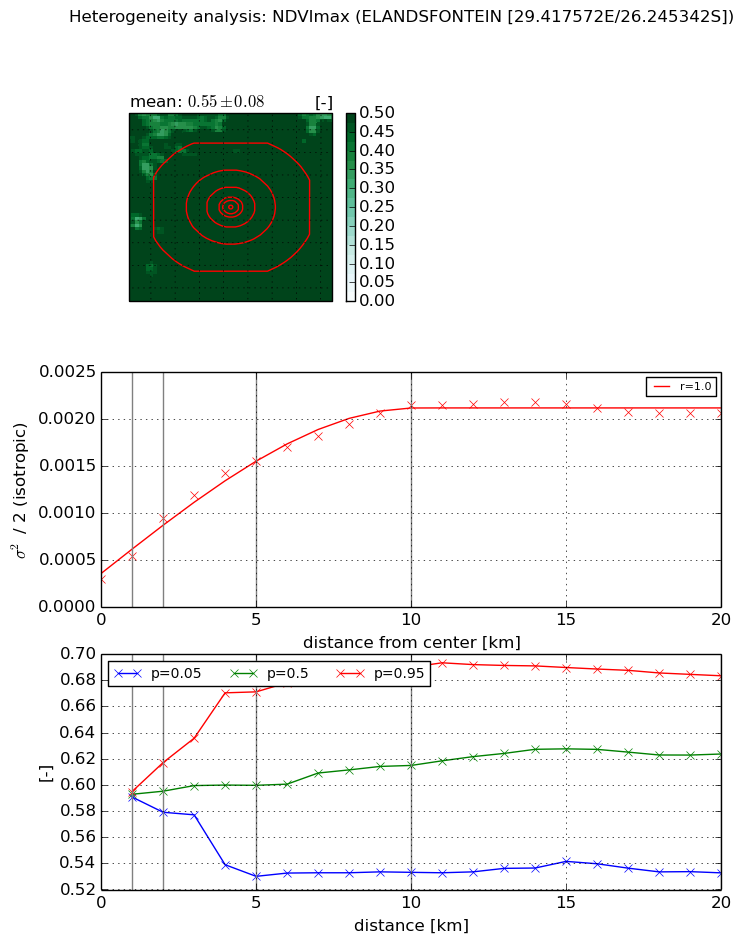
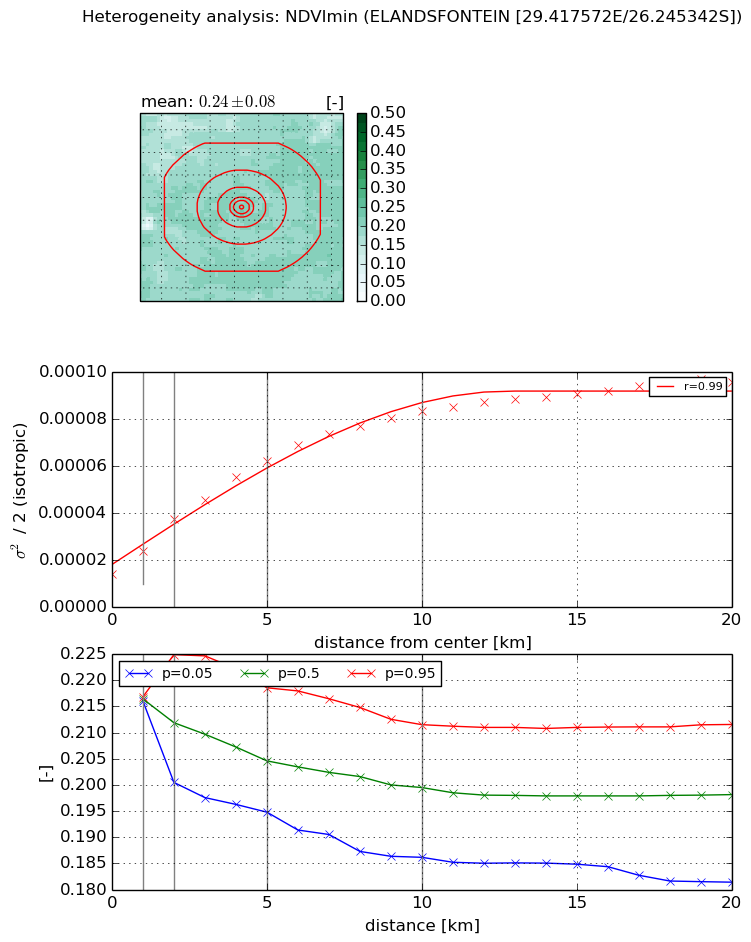
Heterogeneity analysis

The heterogeneity analysis provides information about the spatial and temporal heterogeneity of the site.

Topography


Roman et al. (2009) index


St

1.59669530666

Rcv

0.177728100602

Rse

0.0

Rst

-0.0880749517071

Rsv

1.61307765053


Height range @ 1km [m]

60

Height range @ 2km [m]

98

Height range @ 5km [m]

112

Height range @ 10km [m]

-999

Height range @ 20km [m]

-999


Variance slope @ 1 km

356

Variance slope @ 2 km

376

Variance slope @ 5 km

345

Variance slope @ 10 km

-999

Variance slope @ 20 km

-999


NDVI (max. NDVI composite)


Roman et al. (2009) index


St

nan

Rcv

nan

Rse

nan

Rst

nan

Rsv

nan


NDVI range @ 1km [-]

0.0

NDVI range @ 2km [-]

0.04

NDVI range @ 5km [-]

0.14

NDVI range @ 10km [-]

0.16

NDVI range @ 20km [-]

0.15


Variance slope @ 1 km

0.000246879401761

Variance slope @ 2 km

0.000324162445193

Variance slope @ 5 km

0.000261260886969

Variance slope @ 10 km

0.000180083762439

Variance slope @ 20 km

7.40892786885e-05


NDVI (min. NDVI composite)I


Roman et al. (2009) index


St

7.22820285037

Rcv

-0.0703422076245

Rse

0.0

Rst

0.13777337328

Rsv

-0.206925344496


NDVI range @ 1km [-]

0.0

NDVI range @ 2km [-]

0.02

NDVI range @ 5km [-]

0.02

NDVI range @ 10km [-]

0.03

NDVI range @ 20km [-]

0.03


NDVI slope @ 1 km

9.72788340281e-06

NDVI slope @ 2 km

1.15213399011e-05

NDVI slope @ 5 km

9.74960586886e-06

NDVI slope @ 10 km

6.92990736319e-06

NDVI slope @ 20 km

3.63251950457e-06


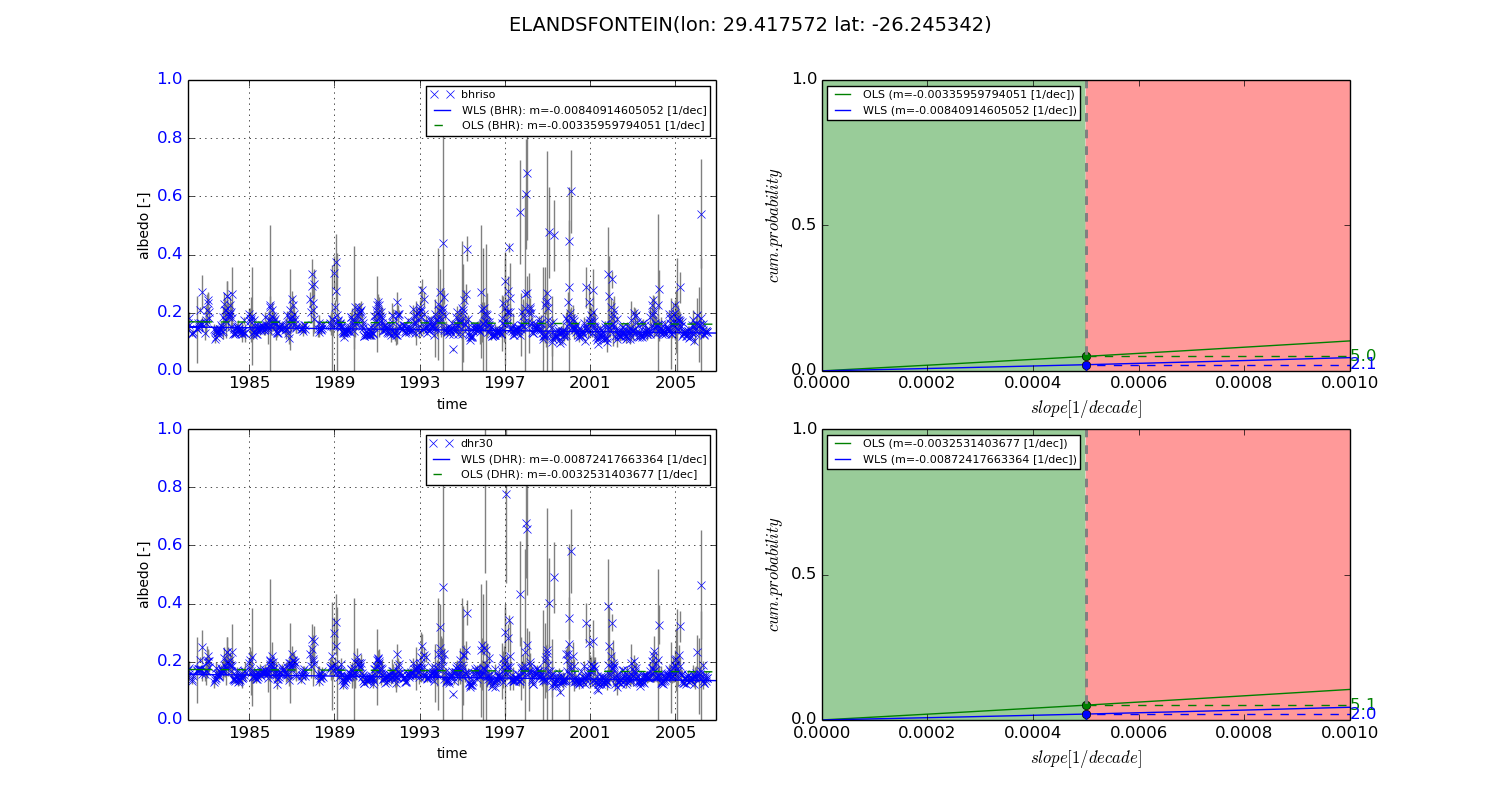
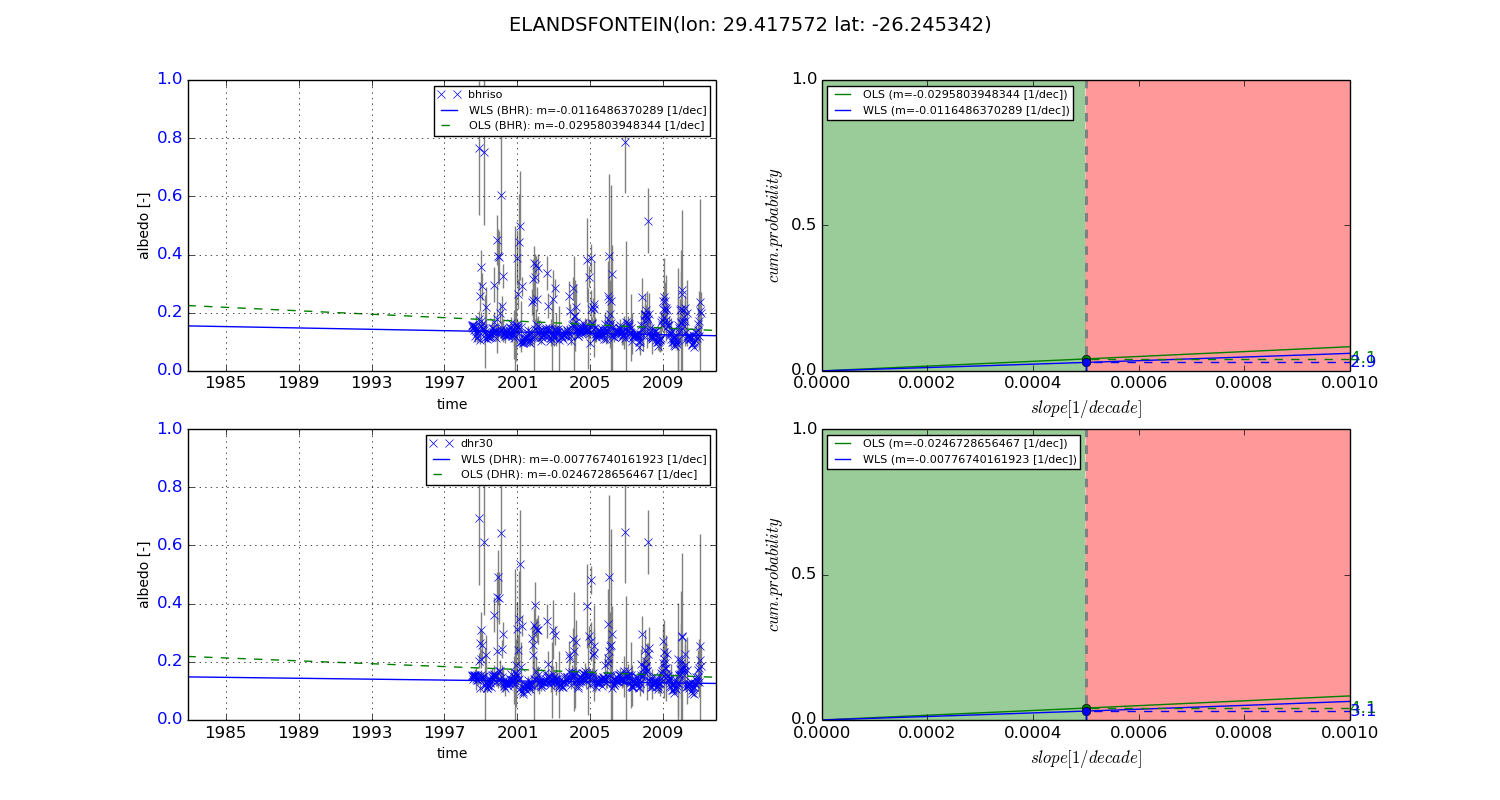
Temporal stability analysis

+000 deg (BHR)


BHR statistics

Temporal stability [1/decade]:


abs

rel


Weighted least square:

-0.00840914605052


Ordinary least square:

-0.00335959794051


Probabilities that GCOS criteria is met:

Weighted least square:

2.1 %

Ordinary least square:

5.0 %


DHR statistics

Temporal stability [1/decade]:


abs

rel


Weighted least square:

-0.00872417663364


Ordinary least square:

-0.0032531403677


Probabilities that GCOS criteria is met:

Weighted least square:

2.0 %

Ordinary least square:

5.1 %


+057/+063 deg (BHR)


BHR statistics

Temporal stability [1/decade]:


abs

rel


Weighted least square:

-0.0116486370289


Ordinary least square:

-0.0295803948344


Probabilities that GCOS criteria is met:

Weighted least square:

2.9 %

Ordinary least square:

4.1 %


DHR statistics

Temporal stability [1/decade]:


abs

rel


Weighted least square:

-0.00776740161923


Ordinary least square:

-0.0246728656467


Probabilities that GCOS criteria is met:

Weighted least square:

3.1 %

Ordinary least square:

4.1 %


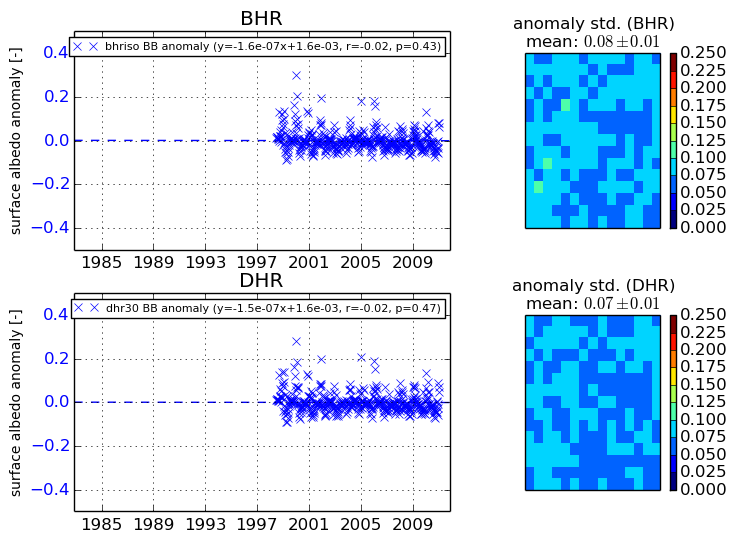
Temporal anomaly analyis

The variance of the temporal anomalies provides an additional measure about the stability of the signal AFTER removal of the mean seasonal cylce.
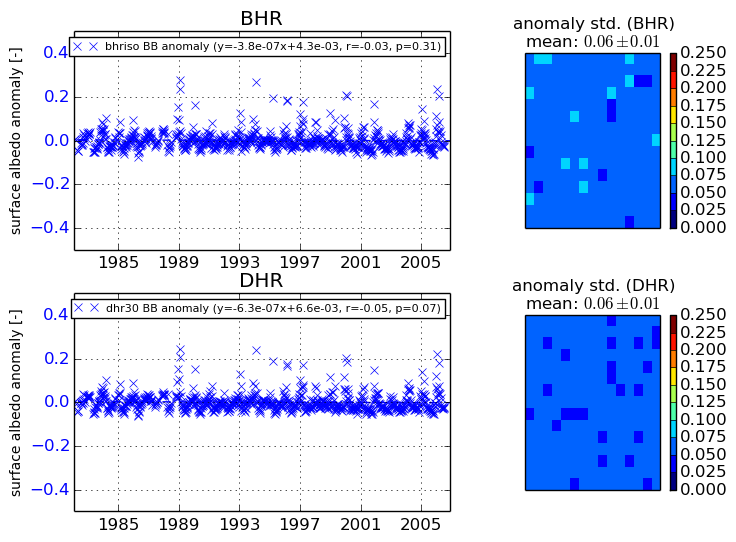
+000 deg


+057/+063 deg