ES-LMA


Location

lon / lat [deg]: -5.7734 / 39.9415

Source network: FLUXNET


Geostationary surface albedo (GSA) data


“+000”


“+057/+063”


Landcover information (based on ESA CCI landcover data)


Landcover fractions @ 2km distance


Landcover fractions @ 20 km distance


Legend


Distance to open water bodies [km]:

2.97

Distance to urban areas [km]:

2.12


Radius: 1 km

Number of landcover classes:

3

Dominant landcover type:

10: cropland, rainfed

Fraction of dominant landcover type [%]:

79.0


Radius: 2 km

Number of landcover classes:

4

Dominant landcover type:

10: cropland, rainfed

Fraction of dominant landcover type [%]:

75.0


Radius: 5 km

Number of landcover classes:

7

Dominant landcover type:

10: cropland, rainfed

Fraction of dominant landcover type [%]:

50.0


Radius: 10 km

Number of landcover classes:

7

Dominant landcover type:

10: cropland, rainfed

Fraction of dominant landcover type [%]:

59.0


Radius: 20 km

Number of landcover classes:

10

Dominant landcover type:

10: cropland, rainfed

Fraction of dominant landcover type [%]:

47.0


Disturbances


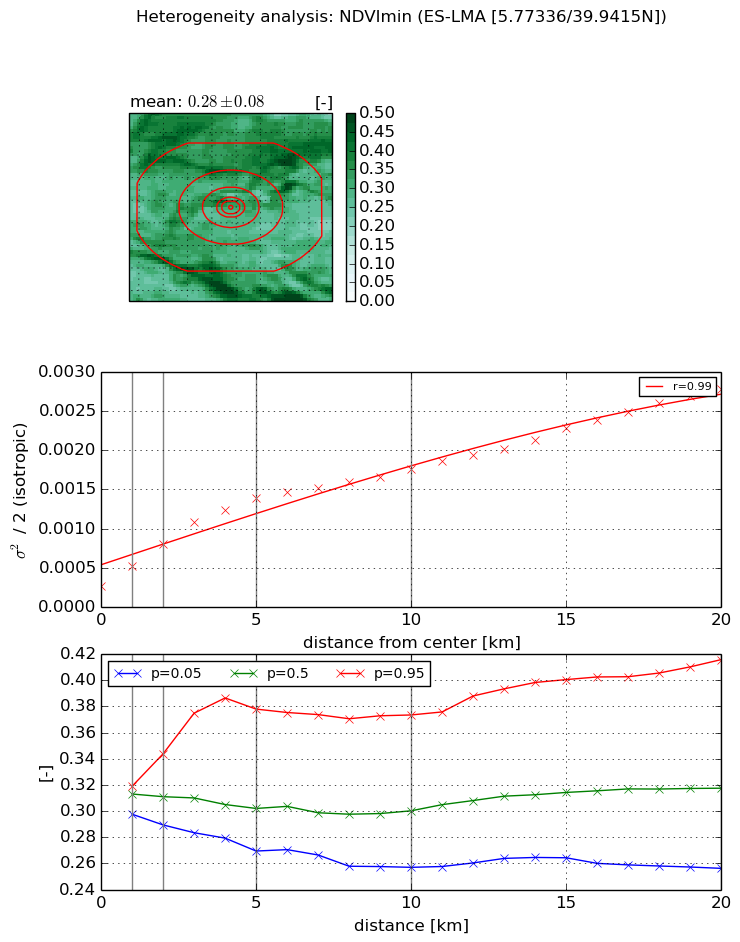
Heterogeneity analysis

The heterogeneity analysis provides information about the spatial and temporal heterogeneity of the site.

Topography


Roman et al. (2009) index


St

6.88031407678e-05

Rcv

0.372153024062

Rse

0.0

Rst

-0.154718272291

Rsv

43602.1337997


Height range @ 1km [m]

13

Height range @ 2km [m]

19

Height range @ 5km [m]

37

Height range @ 10km [m]

-999

Height range @ 20km [m]

-999


Variance slope @ 1 km

81

Variance slope @ 2 km

59

Variance slope @ 5 km

24

Variance slope @ 10 km

-999

Variance slope @ 20 km

-999


NDVI (max. NDVI composite)


Roman et al. (2009) index


St

6.466141987e-09

Rcv

0.0697647686769

Rse

0.0

Rst

0.390375376999

Rsv

463955168.794


NDVI range @ 1km [-]

0.06

NDVI range @ 2km [-]

0.1

NDVI range @ 5km [-]

0.15

NDVI range @ 10km [-]

0.14

NDVI range @ 20km [-]

0.16


Variance slope @ 1 km

0.000314778270224

Variance slope @ 2 km

0.000316581594362

Variance slope @ 5 km

0.000230813768961

Variance slope @ 10 km

0.00014225342316

Variance slope @ 20 km

8.8431983544e-05


NDVI (min. NDVI composite)I


Roman et al. (2009) index


St

5.23690239999

Rcv

0.154027497218

Rse

0.0

Rst

-0.222201366483

Rsv

-0.196628862271


NDVI range @ 1km [-]

0.02

NDVI range @ 2km [-]

0.05

NDVI range @ 5km [-]

0.11

NDVI range @ 10km [-]

0.12

NDVI range @ 20km [-]

0.16


NDVI slope @ 1 km

0.000254834010047

NDVI slope @ 2 km

0.000266083751944

NDVI slope @ 5 km

0.000228154543096

NDVI slope @ 10 km

0.000140810494227

NDVI slope @ 20 km

0.000110709094886


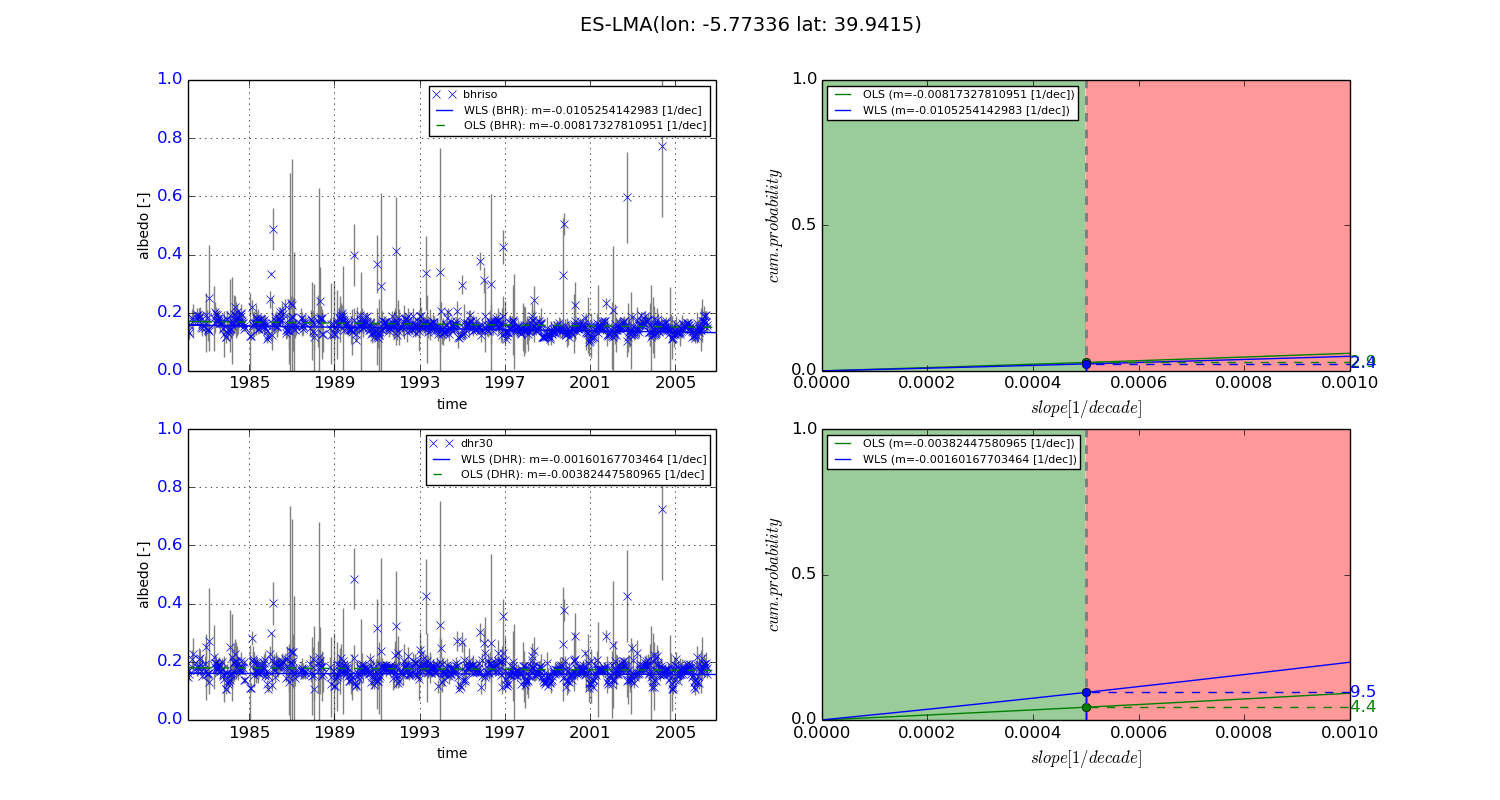
Temporal stability analysis

+000 deg (BHR)


BHR statistics

Temporal stability [1/decade]:


abs

rel


Weighted least square:

-0.0105254142983


Ordinary least square:

-0.00817327810951


Probabilities that GCOS criteria is met:

Weighted least square:

2.4 %

Ordinary least square:

2.9 %


DHR statistics

Temporal stability [1/decade]:


abs

rel


Weighted least square:

-0.00160167703464


Ordinary least square:

-0.00382447580965


Probabilities that GCOS criteria is met:

Weighted least square:

9.5 %

Ordinary least square:

4.4 %


+057/+063 deg (BHR)


BHR statistics

Temporal stability [1/decade]:


abs

rel


Weighted least square:

-99999.0


Ordinary least square:

-99999.0


Probabilities that GCOS criteria is met:

Weighted least square:

-99999.0 %

Ordinary least square:

-99999.0 %


DHR statistics

Temporal stability [1/decade]:


abs

rel


Weighted least square:

-99999.0


Ordinary least square:

-99999.0


Probabilities that GCOS criteria is met:

Weighted least square:

-99999.0 %

Ordinary least square:

-99999.0 %


Temporal anomaly analyis

The variance of the temporal anomalies provides an additional measure about the stability of the signal AFTER removal of the mean seasonal cylce.
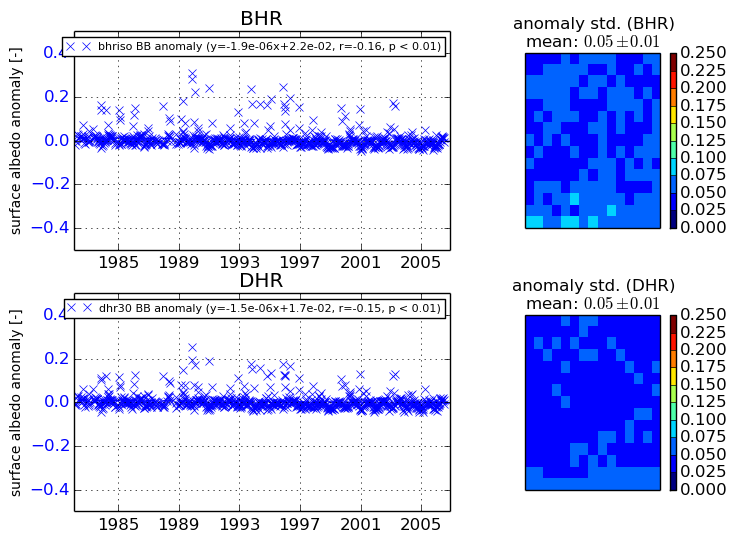
+000 deg


+057/+063 deg