ES-VDA


Location

lon / lat [deg]: 1.4485 / 42.1522

Source network: FLUXNET


Geostationary surface albedo (GSA) data


“+000”


“+057/+063”


Landcover information (based on ESA CCI landcover data)


Landcover fractions @ 2km distance


Landcover fractions @ 20 km distance


Legend


Distance to open water bodies [km]:

10.25

Distance to urban areas [km]:

9.58


Radius: 1 km

Number of landcover classes:

2

Dominant landcover type:

70: Tree cover, needleleaved, evergreen, closed to open (>15%)

Fraction of dominant landcover type [%]:

71.0


Radius: 2 km

Number of landcover classes:

5

Dominant landcover type:

70: Tree cover, needleleaved, evergreen, closed to open (>15%)

Fraction of dominant landcover type [%]:

64.0


Radius: 5 km

Number of landcover classes:

4

Dominant landcover type:

70: Tree cover, needleleaved, evergreen, closed to open (>15%)

Fraction of dominant landcover type [%]:

65.0


Radius: 10 km

Number of landcover classes:

6

Dominant landcover type:

70: Tree cover, needleleaved, evergreen, closed to open (>15%)

Fraction of dominant landcover type [%]:

65.0


Radius: 20 km

Number of landcover classes:

5

Dominant landcover type:

70: Tree cover, needleleaved, evergreen, closed to open (>15%)

Fraction of dominant landcover type [%]:

62.0


Disturbances


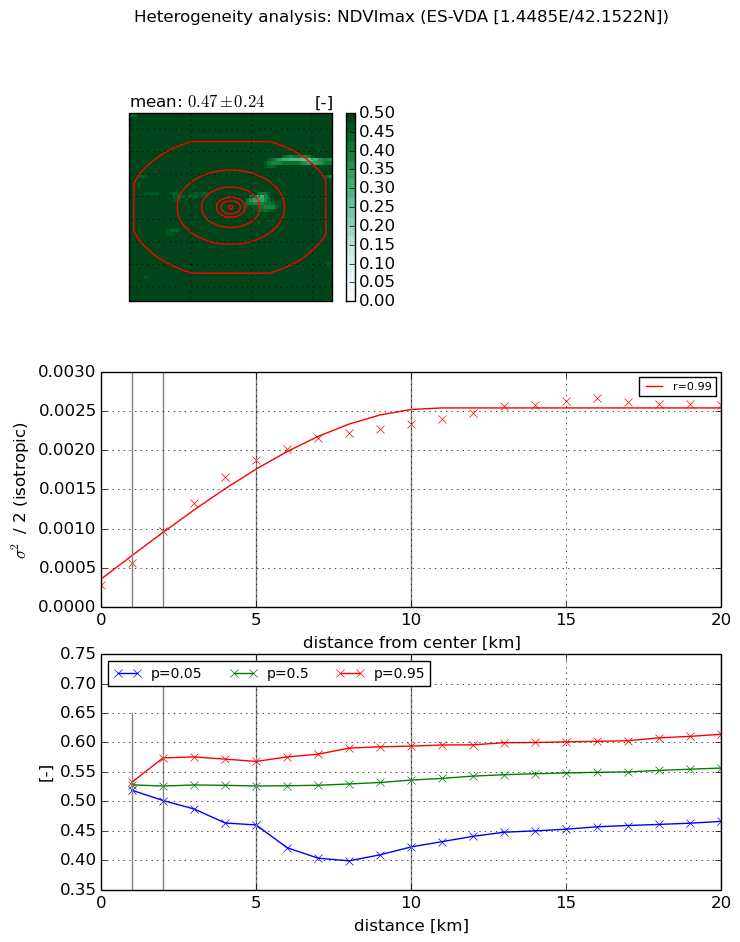
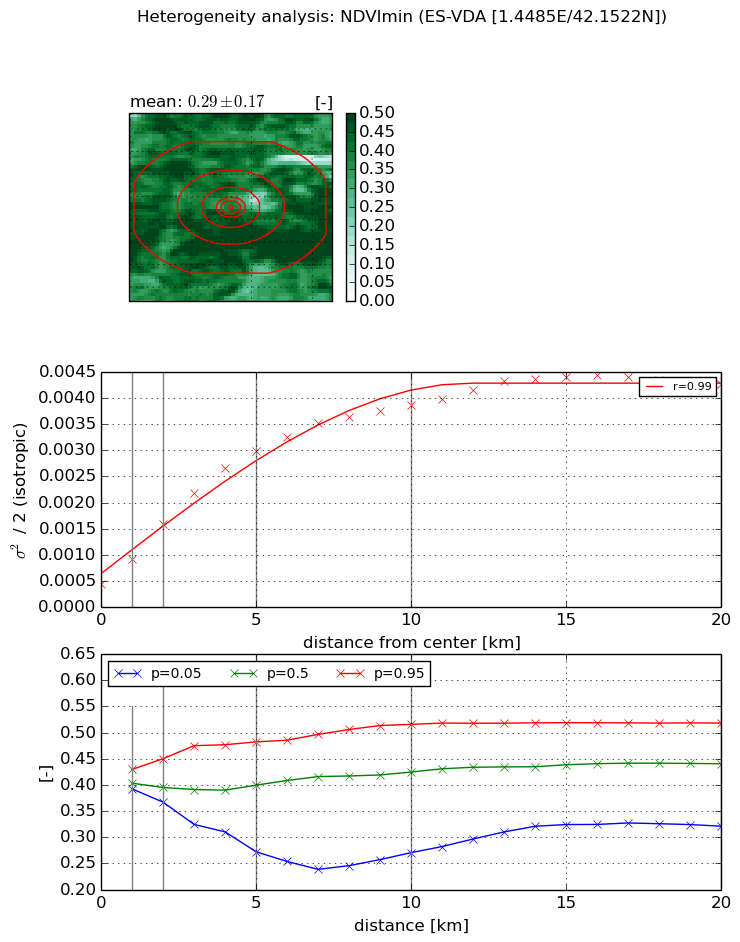
Heterogeneity analysis

The heterogeneity analysis provides information about the spatial and temporal heterogeneity of the site.

Topography


Roman et al. (2009) index


St

5.45321861719

Rcv

0.410612372954

Rse

0.0

Rst

0.0295567495911

Rsv

-0.109964699441


Height range @ 1km [m]

216

Height range @ 2km [m]

666

Height range @ 5km [m]

1104

Height range @ 10km [m]

-999

Height range @ 20km [m]

-999


Variance slope @ 1 km

20693

Variance slope @ 2 km

25429

Variance slope @ 5 km

29386

Variance slope @ 10 km

-999

Variance slope @ 20 km

-999


NDVI (max. NDVI composite)


Roman et al. (2009) index


St

2.54507281529

Rcv

0.368762782832

Rse

0.0

Rst

-0.2014474206

Rsv

0.60853799661


NDVI range @ 1km [-]

0.01

NDVI range @ 2km [-]

0.07

NDVI range @ 5km [-]

0.11

NDVI range @ 10km [-]

0.17

NDVI range @ 20km [-]

0.15


Variance slope @ 1 km

0.000284758332463

Variance slope @ 2 km

0.000346639380826

Variance slope @ 5 km

0.000332055252785

Variance slope @ 10 km

0.000208167795644

Variance slope @ 20 km

9.99543921385e-05


NDVI (min. NDVI composite)I


Roman et al. (2009) index


St

0.077839927199

Rcv

0.403715621137

Rse

0.0

Rst

3.5082094401e-08

Rsv

38.136916484


NDVI range @ 1km [-]

0.04

NDVI range @ 2km [-]

0.08

NDVI range @ 5km [-]

0.21

NDVI range @ 10km [-]

0.25

NDVI range @ 20km [-]

0.2


NDVI slope @ 1 km

0.000472927689538

NDVI slope @ 2 km

0.000572438017744

NDVI slope @ 5 km

0.000529134730354

NDVI slope @ 10 km

0.000343880396125

NDVI slope @ 20 km

0.000171689781462


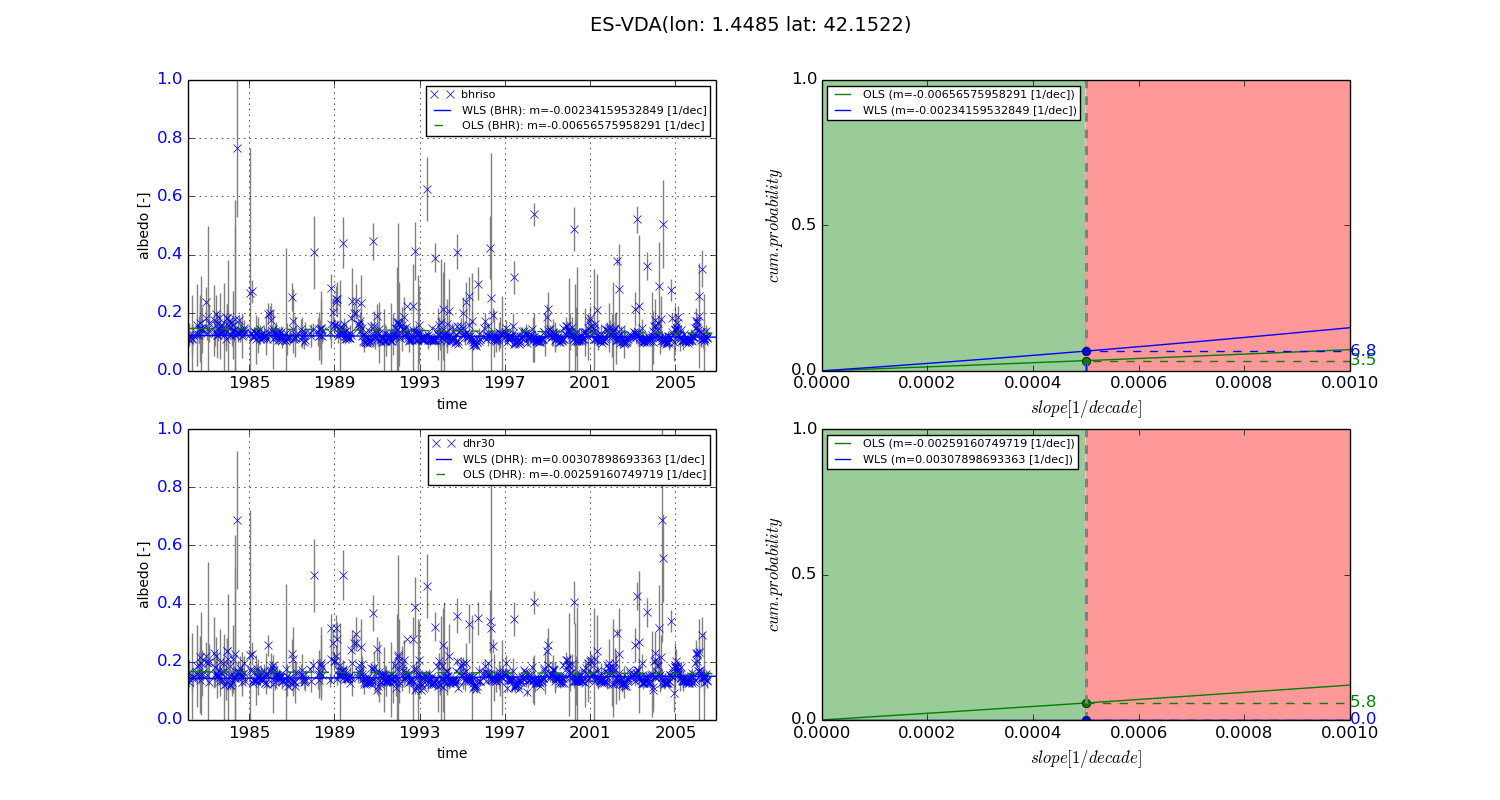
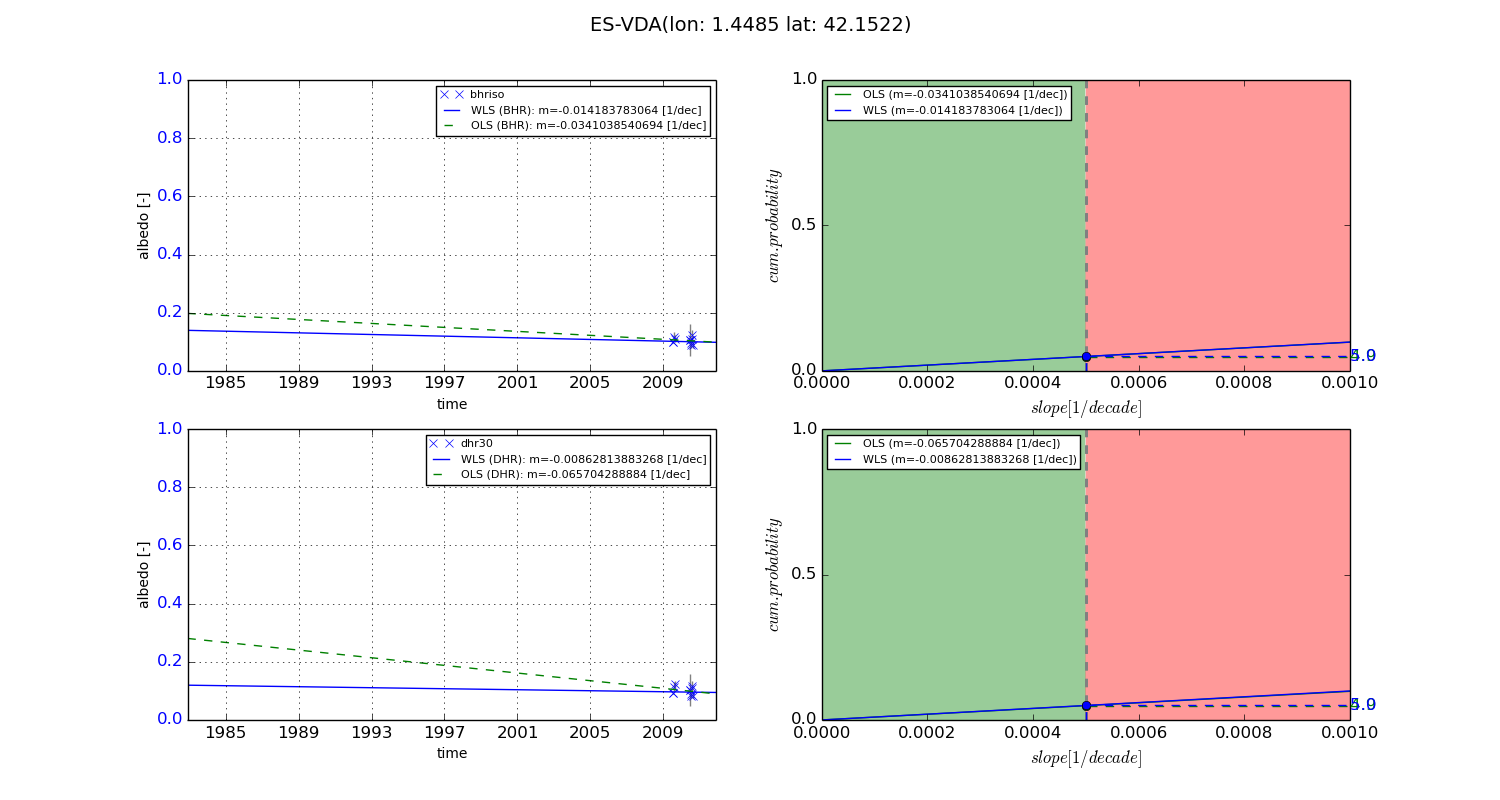
Temporal stability analysis

+000 deg (BHR)


BHR statistics

Temporal stability [1/decade]:


abs

rel


Weighted least square:

-0.00234159532849


Ordinary least square:

-0.00656575958291


Probabilities that GCOS criteria is met:

Weighted least square:

6.8 %

Ordinary least square:

3.5 %


DHR statistics

Temporal stability [1/decade]:


abs

rel


Weighted least square:

0.00307898693363


Ordinary least square:

-0.00259160749719


Probabilities that GCOS criteria is met:

Weighted least square:

0.0 %

Ordinary least square:

5.8 %


+057/+063 deg (BHR)


BHR statistics

Temporal stability [1/decade]:


abs

rel


Weighted least square:

-0.014183783064


Ordinary least square:

-0.0341038540694


Probabilities that GCOS criteria is met:

Weighted least square:

5.0 %

Ordinary least square:

4.9 %


DHR statistics

Temporal stability [1/decade]:


abs

rel


Weighted least square:

-0.00862813883268


Ordinary least square:

-0.065704288884


Probabilities that GCOS criteria is met:

Weighted least square:

5.0 %

Ordinary least square:

4.9 %


Temporal anomaly analyis

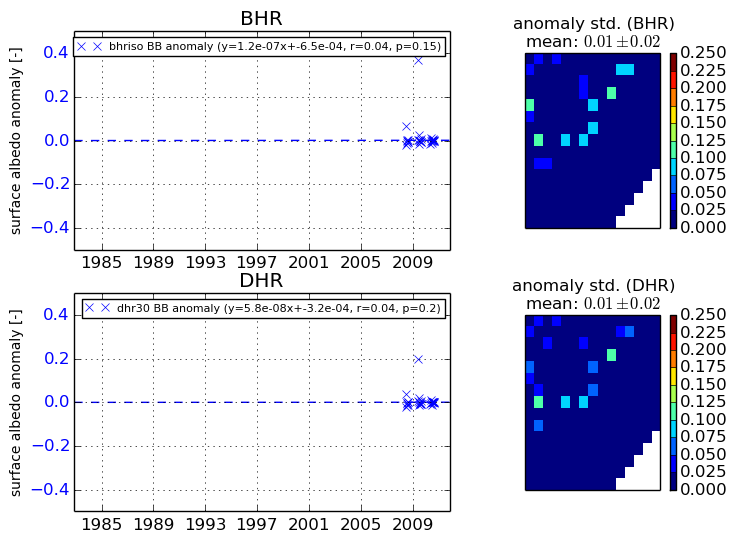
The variance of the temporal anomalies provides an additional measure about the stability of the signal AFTER removal of the mean seasonal cylce.
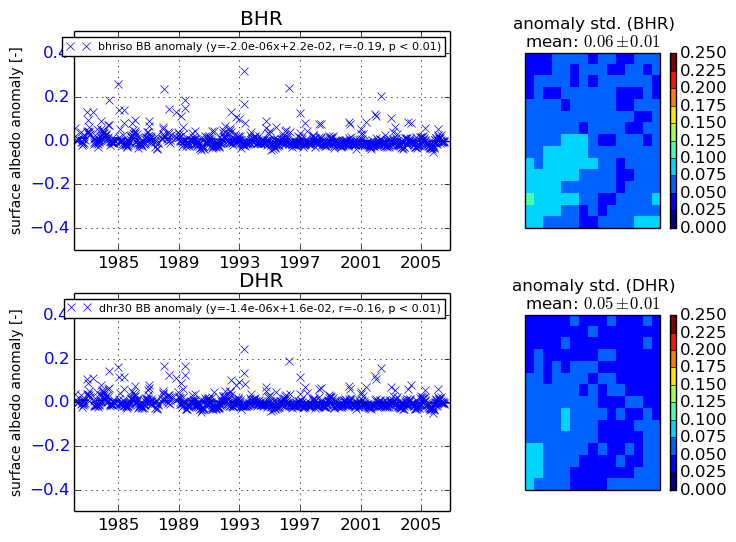
+000 deg


+057/+063 deg