ETOSHA_PAN1


Location

lon / lat [deg]: 16.457 / -18.735

Source network: ALBEDOVAL2


Geostationary surface albedo (GSA) data


“+000”


“+057/+063”


Landcover information (based on ESA CCI landcover data)


Landcover fractions @ 2km distance


Landcover fractions @ 20 km distance


Legend


Distance to open water bodies [km]:

0.03

Distance to urban areas [km]:

none in region


Radius: 1 km

Number of landcover classes:

1

Dominant landcover type:

210: water bodies

Fraction of dominant landcover type [%]:

100.0


Radius: 2 km

Number of landcover classes:

1

Dominant landcover type:

210: water bodies

Fraction of dominant landcover type [%]:

100.0


Radius: 5 km

Number of landcover classes:

1

Dominant landcover type:

210: water bodies

Fraction of dominant landcover type [%]:

100.0


Radius: 10 km

Number of landcover classes:

1

Dominant landcover type:

210: water bodies

Fraction of dominant landcover type [%]:

100.0


Radius: 20 km

Number of landcover classes:

1

Dominant landcover type:

210: water bodies

Fraction of dominant landcover type [%]:

99.0


Disturbances


Heterogeneity analysis

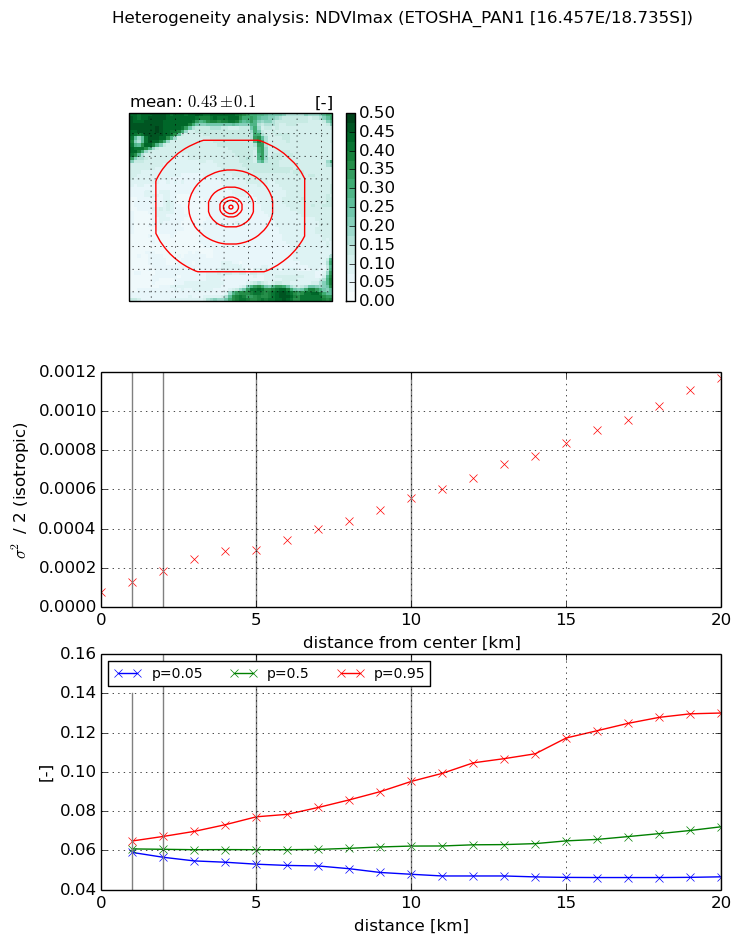
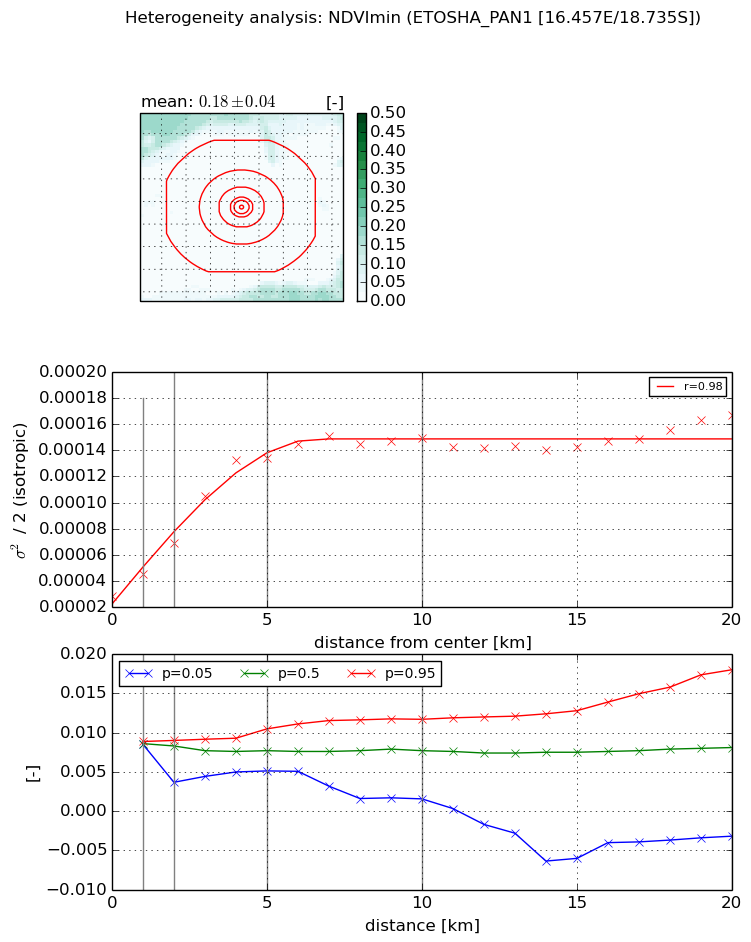
The heterogeneity analysis provides information about the spatial and temporal heterogeneity of the site.

Topography


Roman et al. (2009) index


St

0.115227466986

Rcv

0.0539793302495

Rse

0.0

Rst

1.60494270348e-07

Rsv

25.9814795753


Height range @ 1km [m]

9

Height range @ 2km [m]

12

Height range @ 5km [m]

13

Height range @ 10km [m]

-999

Height range @ 20km [m]

-999


Variance slope @ 1 km

2

Variance slope @ 2 km

1

Variance slope @ 5 km

1

Variance slope @ 10 km

-999

Variance slope @ 20 km

-999


NDVI (max. NDVI composite)


Roman et al. (2009) index


St

0.0364041098733

Rcv

0.502156103868

Rse

0.0

Rst

9.2044101297e-07

Rsv

81.9061207895


NDVI range @ 1km [-]

0.01

NDVI range @ 2km [-]

0.01

NDVI range @ 5km [-]

0.02

NDVI range @ 10km [-]

0.05

NDVI range @ 20km [-]

0.08


Variance slope @ 1 km

5.11611326965e-05

Variance slope @ 2 km

5.3687399616e-05

Variance slope @ 5 km

4.57018155393e-05

Variance slope @ 10 km

4.51674305341e-05

Variance slope @ 20 km

5.33022567959e-05


NDVI (min. NDVI composite)I


Roman et al. (2009) index


St

2.10660603013

Rcv

-0.0392588204687

Rse

0.0

Rst

-0.384832917268

Rsv

-0.999999885042


NDVI range @ 1km [-]

0.0

NDVI range @ 2km [-]

0.01

NDVI range @ 5km [-]

0.01

NDVI range @ 10km [-]

0.01

NDVI range @ 20km [-]

0.02


NDVI slope @ 1 km

1.71972788158e-05

NDVI slope @ 2 km

2.0352732001e-05

NDVI slope @ 5 km

2.35522532776e-05

NDVI slope @ 10 km

1.21927632554e-05

NDVI slope @ 20 km

4.56361542238e-06


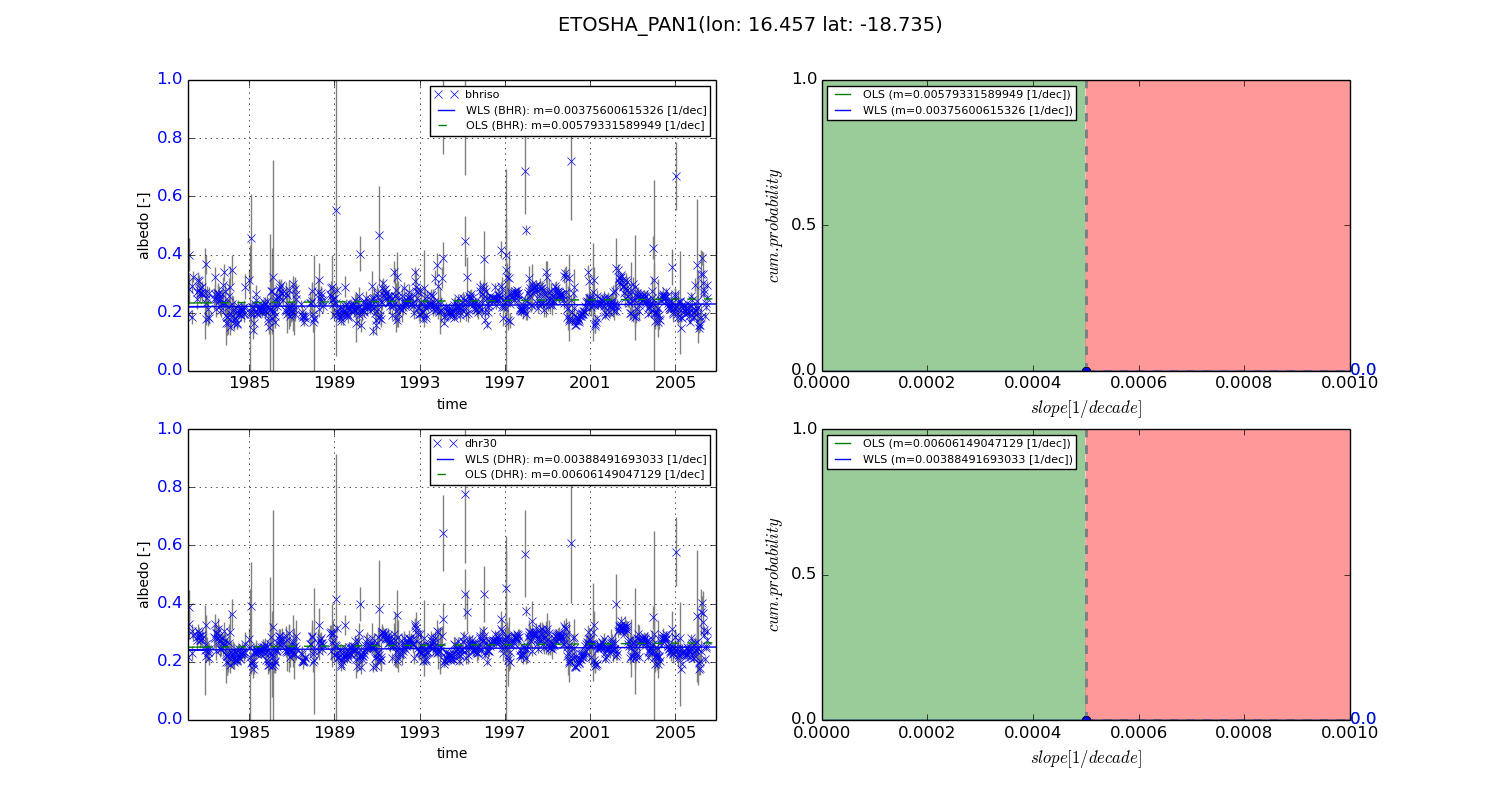
Temporal stability analysis

+000 deg (BHR)


BHR statistics

Temporal stability [1/decade]:


abs

rel


Weighted least square:

0.00375600615326


Ordinary least square:

0.00579331589949


Probabilities that GCOS criteria is met:

Weighted least square:

0.0 %

Ordinary least square:

0.0 %


DHR statistics

Temporal stability [1/decade]:


abs

rel


Weighted least square:

0.00388491693033


Ordinary least square:

0.00606149047129


Probabilities that GCOS criteria is met:

Weighted least square:

0.0 %

Ordinary least square:

0.0 %


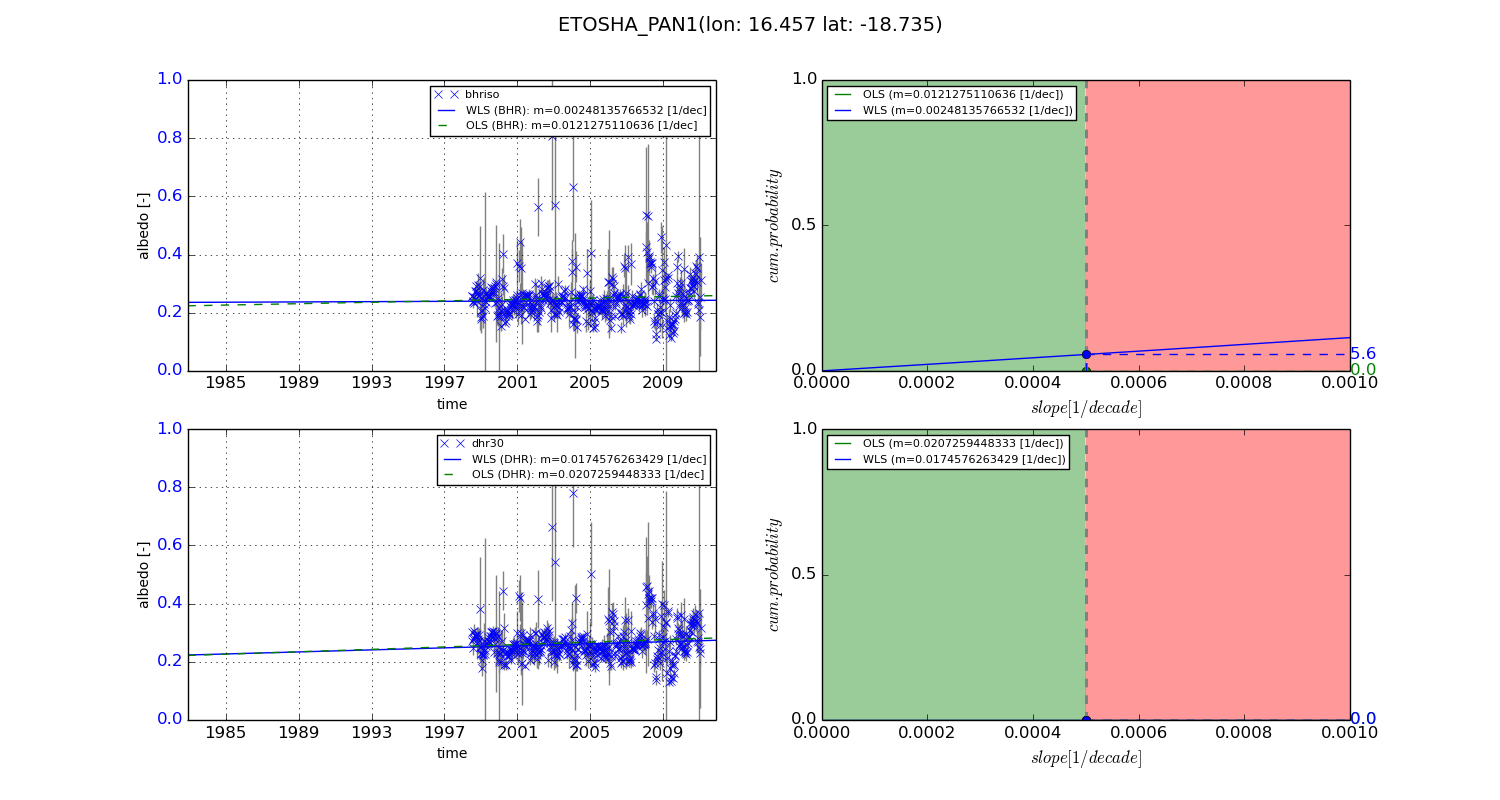
+057/+063 deg (BHR)


BHR statistics

Temporal stability [1/decade]:


abs

rel


Weighted least square:

0.00248135766532


Ordinary least square:

0.0121275110636


Probabilities that GCOS criteria is met:

Weighted least square:

5.6 %

Ordinary least square:

0.0 %


DHR statistics

Temporal stability [1/decade]:


abs

rel


Weighted least square:

0.0174576263429


Ordinary least square:

0.0207259448333


Probabilities that GCOS criteria is met:

Weighted least square:

0.0 %

Ordinary least square:

0.0 %


Temporal anomaly analyis

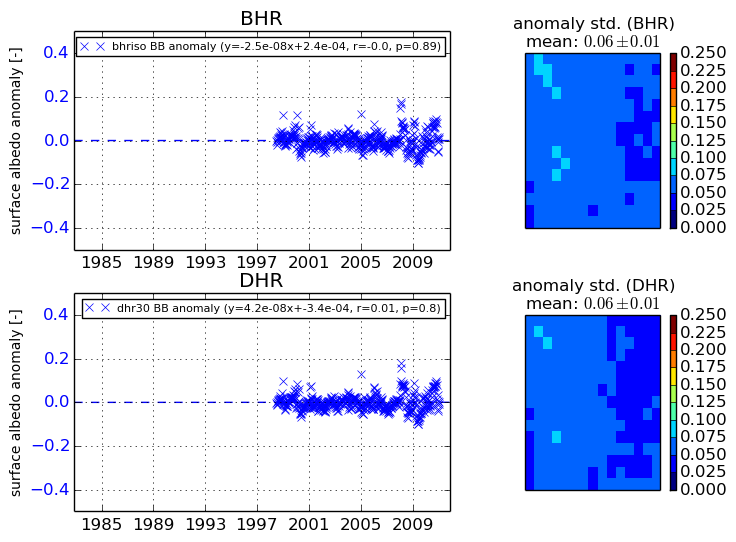
The variance of the temporal anomalies provides an additional measure about the stability of the signal AFTER removal of the mean seasonal cylce.
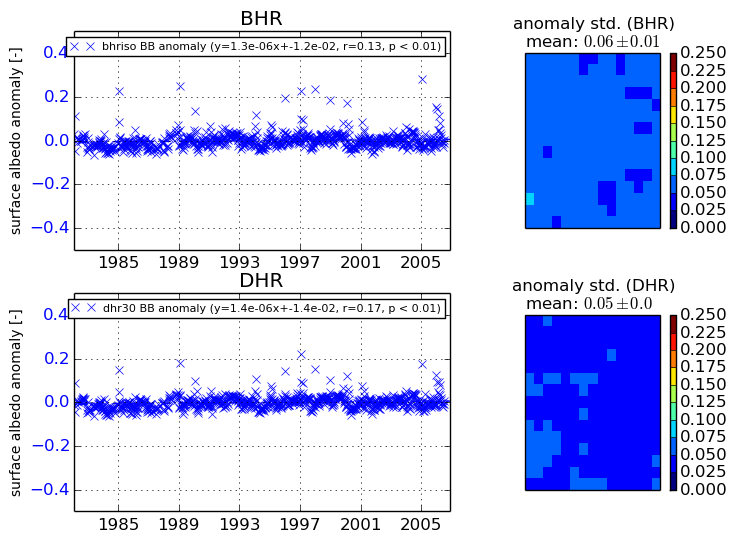
+000 deg


+057/+063 deg