ETOSHA_PAN2


Location

lon / lat [deg]: 16.189 / -18.85

Source network: ALBEDOVAL2


Geostationary surface albedo (GSA) data


“+000”


“+057/+063”


Landcover information (based on ESA CCI landcover data)


Landcover fractions @ 2km distance


Landcover fractions @ 20 km distance


Legend


Distance to open water bodies [km]:

0.2

Distance to urban areas [km]:

none in region


Radius: 1 km

Number of landcover classes:

1

Dominant landcover type:

210: water bodies

Fraction of dominant landcover type [%]:

100.0


Radius: 2 km

Number of landcover classes:

1

Dominant landcover type:

210: water bodies

Fraction of dominant landcover type [%]:

100.0


Radius: 5 km

Number of landcover classes:

1

Dominant landcover type:

210: water bodies

Fraction of dominant landcover type [%]:

100.0


Radius: 10 km

Number of landcover classes:

1

Dominant landcover type:

210: water bodies

Fraction of dominant landcover type [%]:

100.0


Radius: 20 km

Number of landcover classes:

4

Dominant landcover type:

210: water bodies

Fraction of dominant landcover type [%]:

94.0


Disturbances


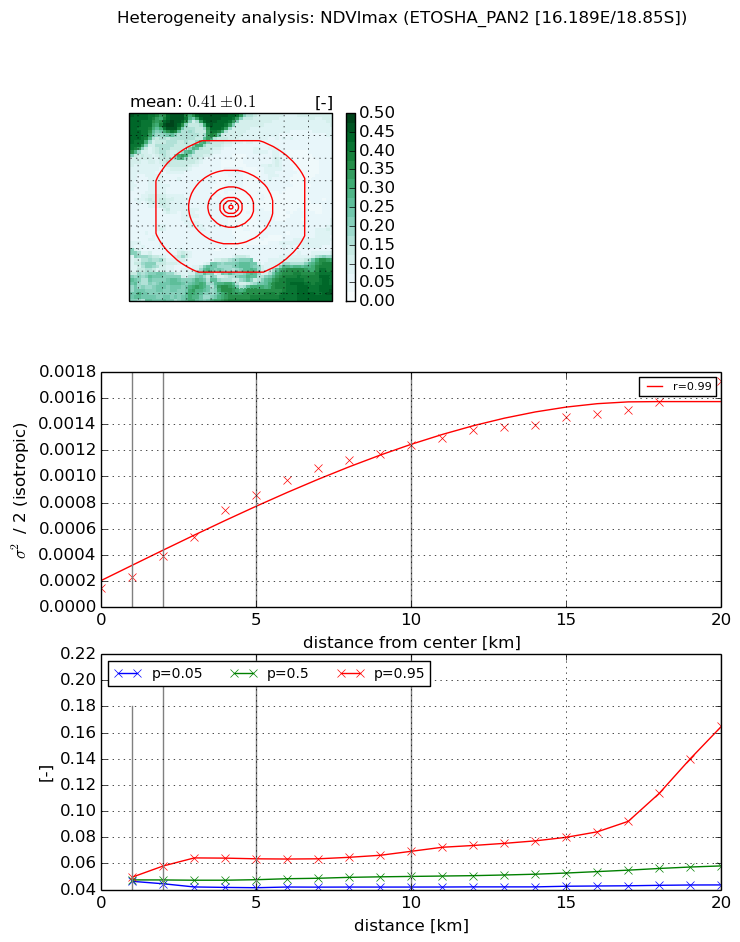
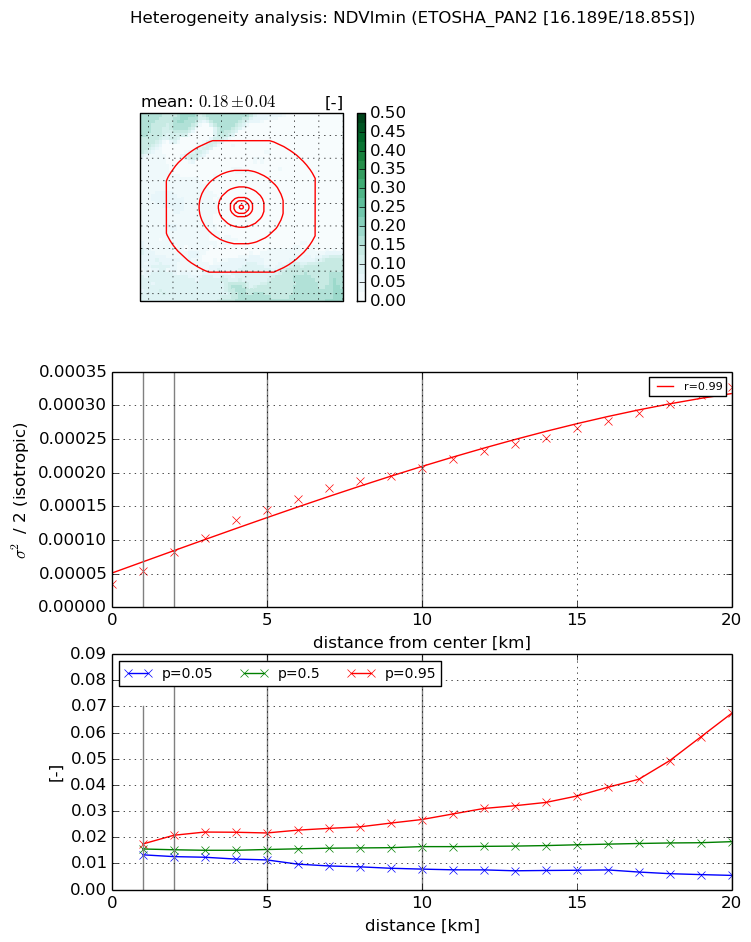
Heterogeneity analysis

The heterogeneity analysis provides information about the spatial and temporal heterogeneity of the site.

Topography


Roman et al. (2009) index


St

nan

Rcv

0.00729467241795

Rse

nan

Rst

nan

Rsv

-0.0319399220748


Height range @ 1km [m]

6

Height range @ 2km [m]

6

Height range @ 5km [m]

6

Height range @ 10km [m]

-999

Height range @ 20km [m]

-999


Variance slope @ 1 km

0

Variance slope @ 2 km

0

Variance slope @ 5 km

0

Variance slope @ 10 km

-999

Variance slope @ 20 km

-999


NDVI (max. NDVI composite)


Roman et al. (2009) index


St

4.52053716718

Rcv

-0.0188220191226

Rse

0.0

Rst

-0.47311861991

Rsv

0.171697306869


NDVI range @ 1km [-]

0.0

NDVI range @ 2km [-]

0.01

NDVI range @ 5km [-]

0.02

NDVI range @ 10km [-]

0.03

NDVI range @ 20km [-]

0.12


Variance slope @ 1 km

8.73129220636e-05

Variance slope @ 2 km

0.00012435802923

Variance slope @ 5 km

0.000149353337658

Variance slope @ 10 km

0.000115818822847

Variance slope @ 20 km

7.20295165847e-05


NDVI (min. NDVI composite)I


Roman et al. (2009) index


St

4.0453698807

Rcv

-0.0250693769592

Rse

0.0

Rst

-0.120133752452

Rsv

0.596385424534


NDVI range @ 1km [-]

0.0

NDVI range @ 2km [-]

0.01

NDVI range @ 5km [-]

0.01

NDVI range @ 10km [-]

0.02

NDVI range @ 20km [-]

0.06


NDVI slope @ 1 km

1.94911520561e-05

NDVI slope @ 2 km

2.33364568877e-05

NDVI slope @ 5 km

2.28054177123e-05

NDVI slope @ 10 km

1.74772256095e-05

NDVI slope @ 20 km

1.36407224342e-05


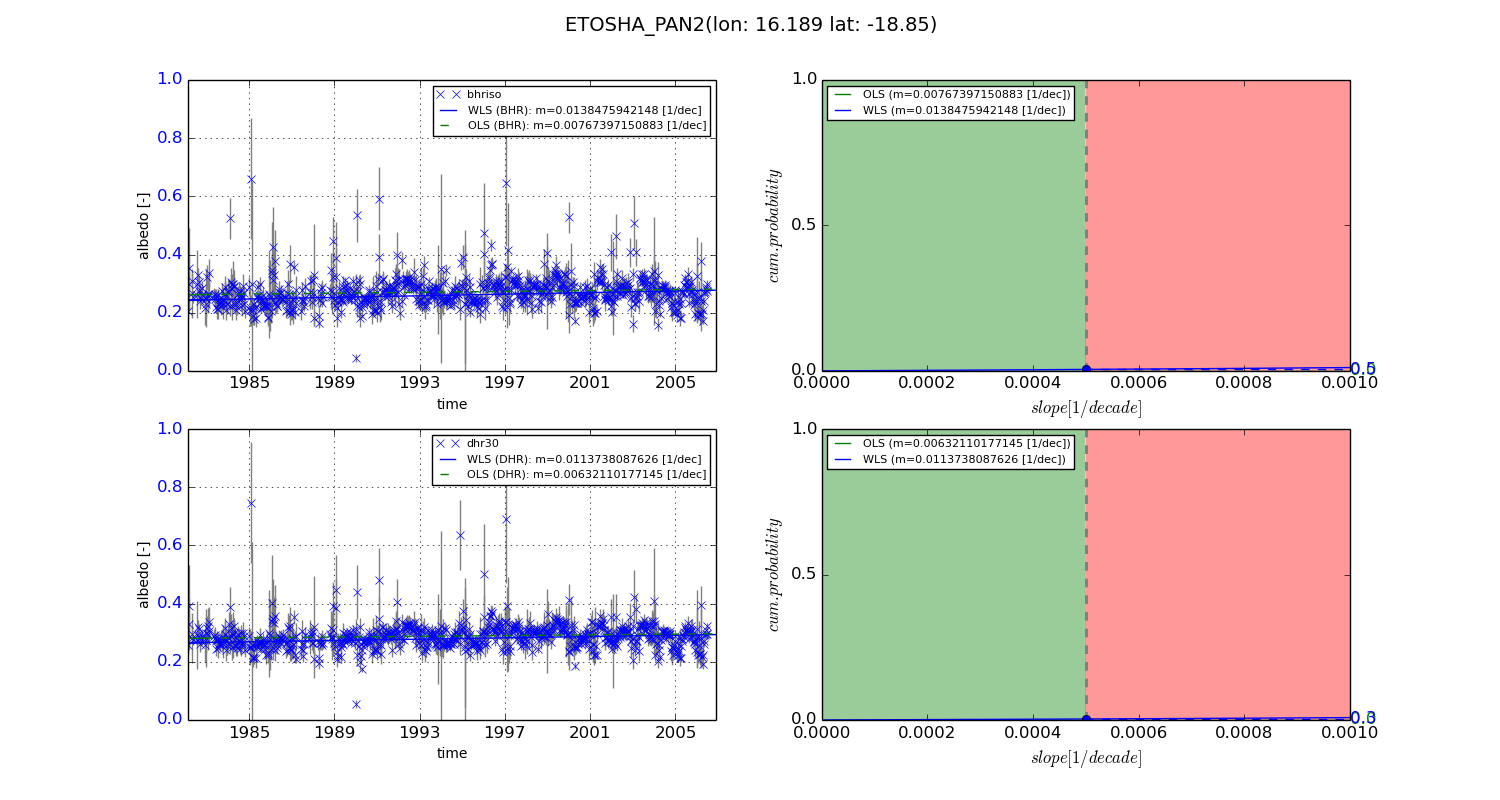
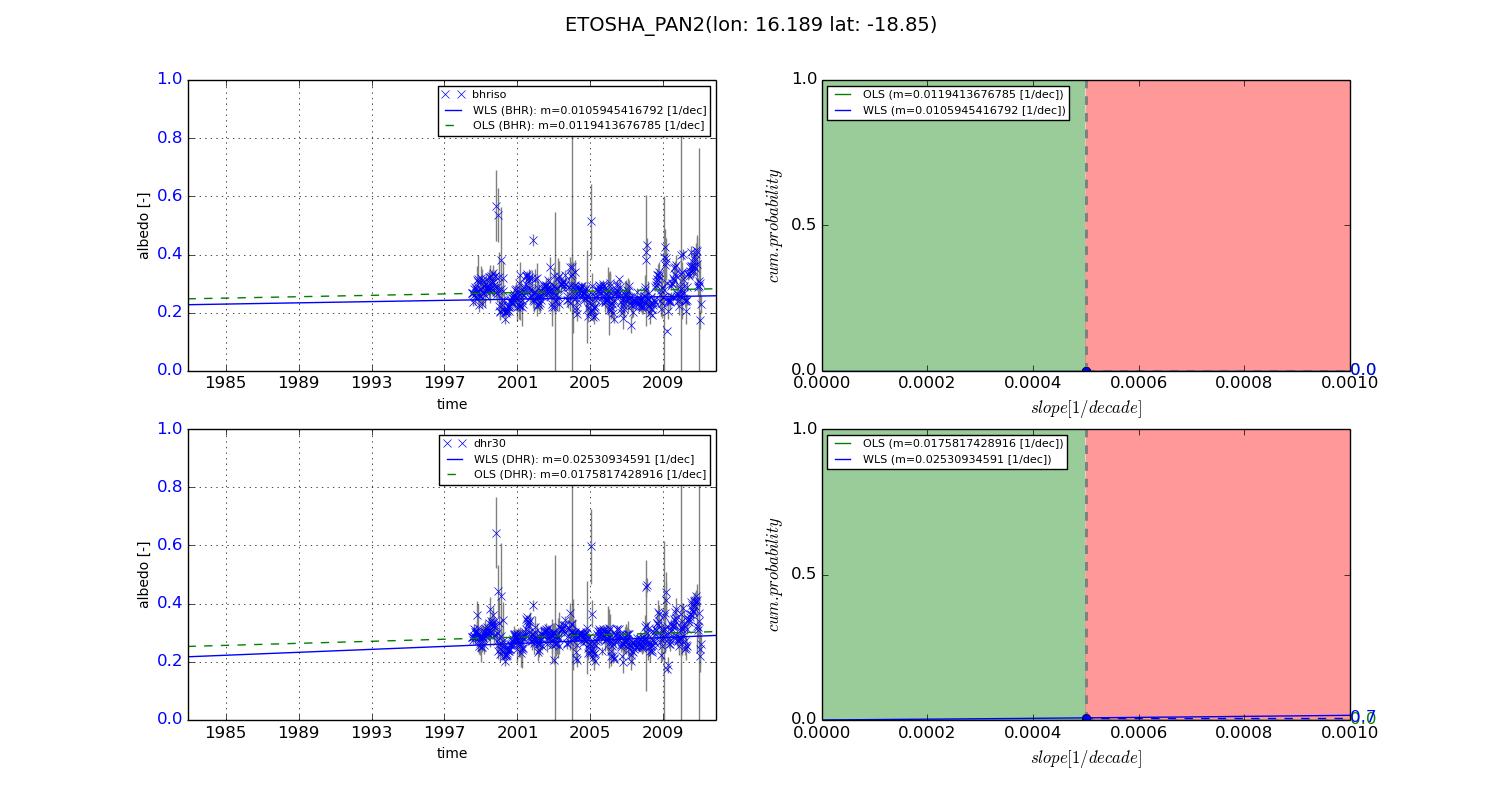
Temporal stability analysis

+000 deg (BHR)


BHR statistics

Temporal stability [1/decade]:


abs

rel


Weighted least square:

0.0138475942148


Ordinary least square:

0.00767397150883


Probabilities that GCOS criteria is met:

Weighted least square:

0.5 %

Ordinary least square:

0.0 %


DHR statistics

Temporal stability [1/decade]:


abs

rel


Weighted least square:

0.0113738087626


Ordinary least square:

0.00632110177145


Probabilities that GCOS criteria is met:

Weighted least square:

0.3 %

Ordinary least square:

0.0 %


+057/+063 deg (BHR)


BHR statistics

Temporal stability [1/decade]:


abs

rel


Weighted least square:

0.0105945416792


Ordinary least square:

0.0119413676785


Probabilities that GCOS criteria is met:

Weighted least square:

0.0 %

Ordinary least square:

0.0 %


DHR statistics

Temporal stability [1/decade]:


abs

rel


Weighted least square:

0.02530934591


Ordinary least square:

0.0175817428916


Probabilities that GCOS criteria is met:

Weighted least square:

0.7 %

Ordinary least square:

0.0 %


Temporal anomaly analyis

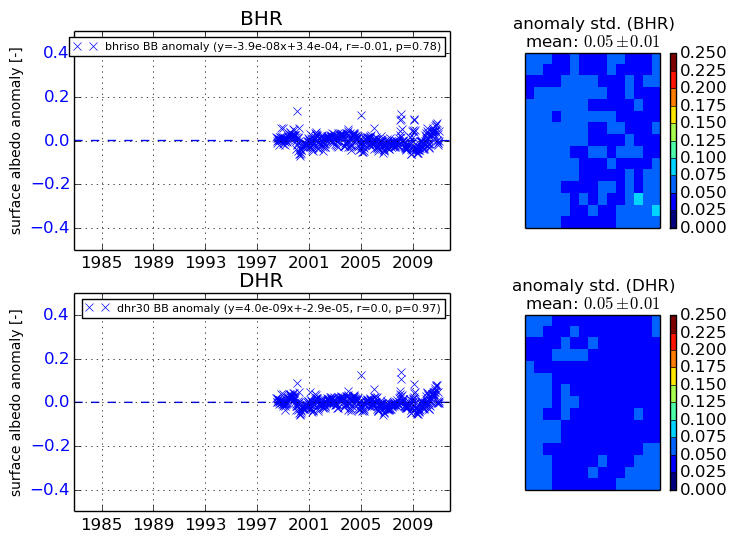
The variance of the temporal anomalies provides an additional measure about the stability of the signal AFTER removal of the mean seasonal cylce.
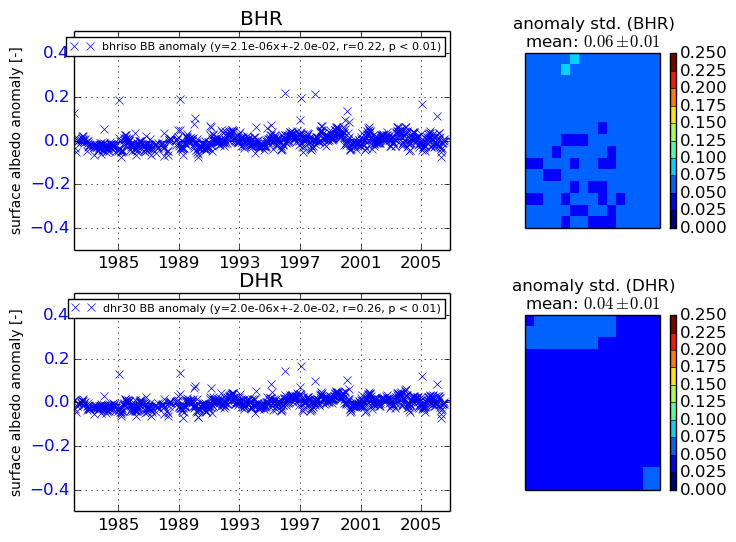
+000 deg


+057/+063 deg