EVK2-CNR


Location

lon / lat [deg]: 86.8133 / 27.9586

Source network: AERONET


Geostationary surface albedo (GSA) data


“+000”


“+057/+063”


Landcover information (based on ESA CCI landcover data)


Landcover fractions @ 2km distance


Landcover fractions @ 20 km distance


Legend


Distance to open water bodies [km]:

2.86

Distance to urban areas [km]:

none in region


Radius: 1 km

Number of landcover classes:

3

Dominant landcover type:

130: grassland

Fraction of dominant landcover type [%]:

49.0


Radius: 2 km

Number of landcover classes:

3

Dominant landcover type:

130: grassland

Fraction of dominant landcover type [%]:

50.0


Radius: 5 km

Number of landcover classes:

3

Dominant landcover type:

220: permanent snow and ice

Fraction of dominant landcover type [%]:

49.0


Radius: 10 km

Number of landcover classes:

4

Dominant landcover type:

220: permanent snow and ice

Fraction of dominant landcover type [%]:

56.0


Radius: 20 km

Number of landcover classes:

5

Dominant landcover type:

220: permanent snow and ice

Fraction of dominant landcover type [%]:

62.0


Disturbances


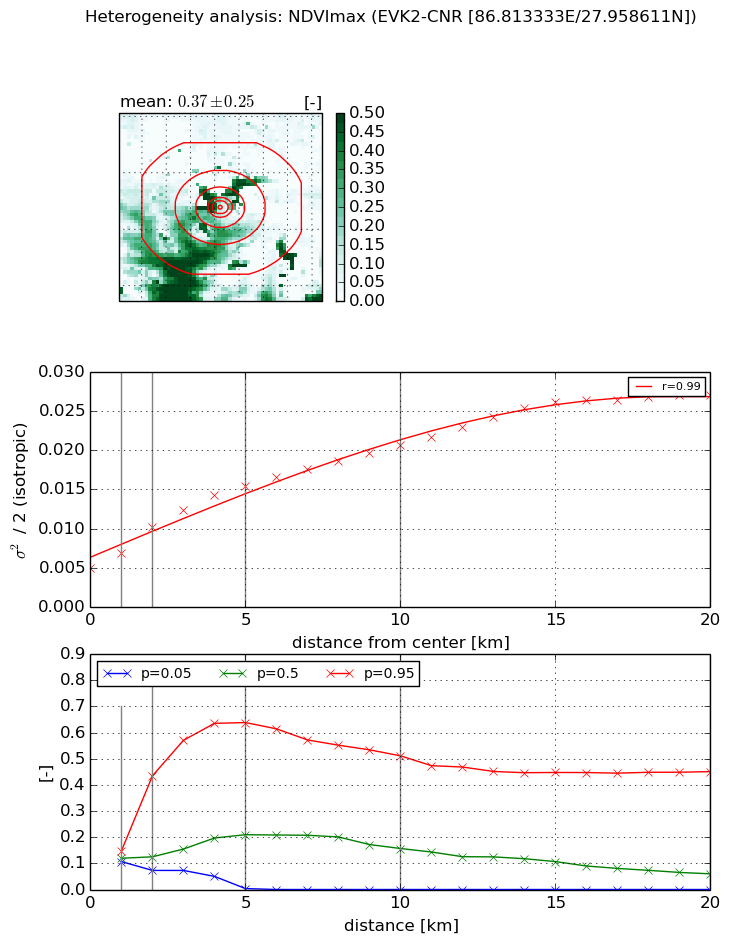
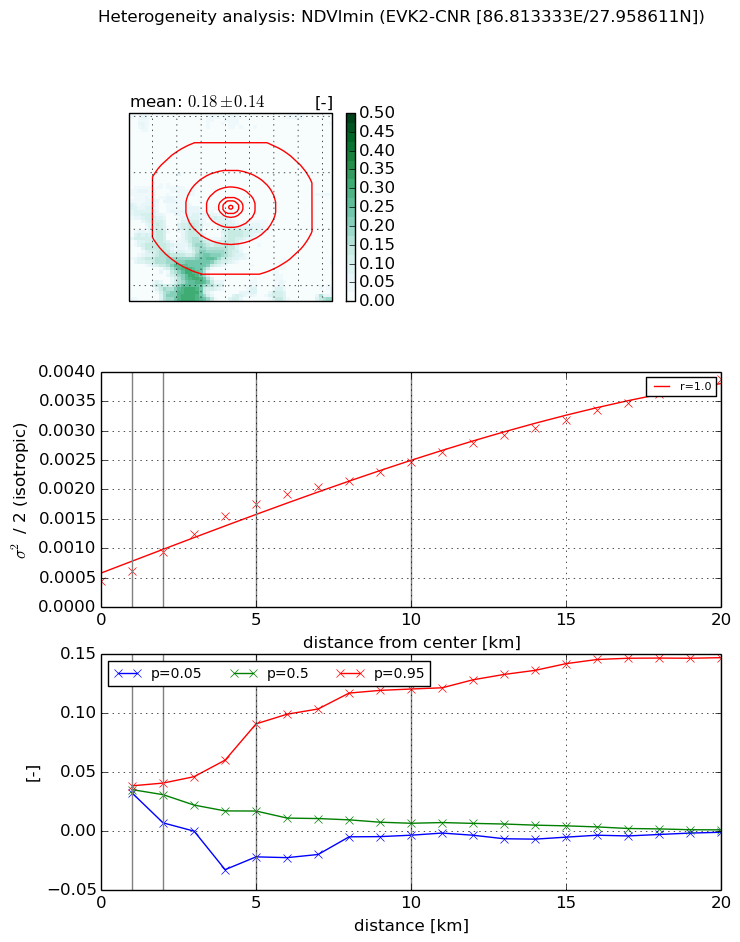
Heterogeneity analysis

The heterogeneity analysis provides information about the spatial and temporal heterogeneity of the site.

Topography


Roman et al. (2009) index


St

1.85841756414

Rcv

0.45227927588

Rse

0.0

Rst

-0.054835618173

Rsv

1.10716171304


Height range @ 1km [m]

288

Height range @ 2km [m]

561

Height range @ 5km [m]

1011

Height range @ 10km [m]

-999

Height range @ 20km [m]

-999


Variance slope @ 1 km

28293

Variance slope @ 2 km

29499

Variance slope @ 5 km

22007

Variance slope @ 10 km

-999

Variance slope @ 20 km

-999


NDVI (max. NDVI composite)


Roman et al. (2009) index


St

1.45486925455

Rcv

0.043079771843

Rse

0.0

Rst

-0.312141231754

Rsv

1.7068199603


NDVI range @ 1km [-]

0.04

NDVI range @ 2km [-]

0.36

NDVI range @ 5km [-]

0.64

NDVI range @ 10km [-]

0.51

NDVI range @ 20km [-]

0.45


Variance slope @ 1 km

0.00193152099032

Variance slope @ 2 km

0.00263468391955

Variance slope @ 5 km

0.00219959287199

Variance slope @ 10 km

0.00152760352548

Variance slope @ 20 km

0.00107208109822


NDVI (min. NDVI composite)I


Roman et al. (2009) index


St

1.23109334491

Rcv

1.9925184867

Rse

0.0

Rst

-0.0251161030718

Rsv

0.419223681287


NDVI range @ 1km [-]

0.01

NDVI range @ 2km [-]

0.03

NDVI range @ 5km [-]

0.11

NDVI range @ 10km [-]

0.12

NDVI range @ 20km [-]

0.15


NDVI slope @ 1 km

0.000166906758538

NDVI slope @ 2 km

0.000249071482162

NDVI slope @ 5 km

0.000275832431498

NDVI slope @ 10 km

0.000204477021679

NDVI slope @ 20 km

0.000164533731056


Temporal stability analysis

+000 deg (BHR)


BHR statistics

Temporal stability [1/decade]:


abs

rel


Weighted least square:

None


Ordinary least square:

None


Probabilities that GCOS criteria is met:

Weighted least square:

None %

Ordinary least square:

None %


DHR statistics

Temporal stability [1/decade]:


abs

rel


Weighted least square:

None


Ordinary least square:

None


Probabilities that GCOS criteria is met:

Weighted least square:

None %

Ordinary least square:

None %


+057/+063 deg (BHR)


BHR statistics

Temporal stability [1/decade]:


abs

rel


Weighted least square:

-0.0278851615791


Ordinary least square:

0.0011320899996


Probabilities that GCOS criteria is met:

Weighted least square:

3.6 %

Ordinary least square:

5.1 %


DHR statistics

Temporal stability [1/decade]:


abs

rel


Weighted least square:

-0.0249157891938


Ordinary least square:

-0.00279960640972


Probabilities that GCOS criteria is met:

Weighted least square:

3.6 %

Ordinary least square:

5.0 %


Temporal anomaly analyis

The variance of the temporal anomalies provides an additional measure about the stability of the signal AFTER removal of the mean seasonal cylce.

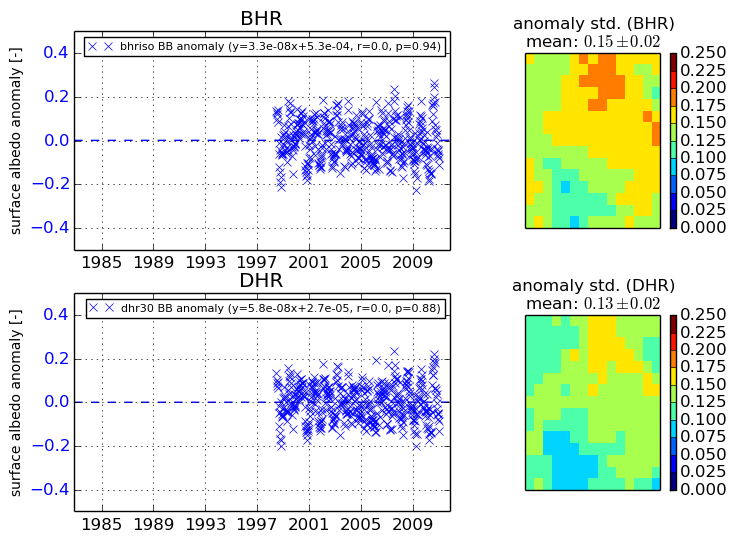
+000 deg


+057/+063 deg