FI-SII


Location

lon / lat [deg]: 24.193 / 61.833

Source network: FLUXNET


Geostationary surface albedo (GSA) data


“+000”


“+057/+063”


Landcover information (based on ESA CCI landcover data)


Landcover fractions @ 2km distance


Landcover fractions @ 20 km distance


Legend


Distance to open water bodies [km]:

2.02

Distance to urban areas [km]:

2.78


Radius: 1 km

Number of landcover classes:

4

Dominant landcover type:

70: Tree cover, needleleaved, evergreen, closed to open (>15%)

Fraction of dominant landcover type [%]:

45.0


Radius: 2 km

Number of landcover classes:

5

Dominant landcover type:

70: Tree cover, needleleaved, evergreen, closed to open (>15%)

Fraction of dominant landcover type [%]:

60.0


Radius: 5 km

Number of landcover classes:

5

Dominant landcover type:

70: Tree cover, needleleaved, evergreen, closed to open (>15%)

Fraction of dominant landcover type [%]:

80.0


Radius: 10 km

Number of landcover classes:

5

Dominant landcover type:

70: Tree cover, needleleaved, evergreen, closed to open (>15%)

Fraction of dominant landcover type [%]:

82.0


Radius: 20 km

Number of landcover classes:

7

Dominant landcover type:

70: Tree cover, needleleaved, evergreen, closed to open (>15%)

Fraction of dominant landcover type [%]:

70.0


Disturbances


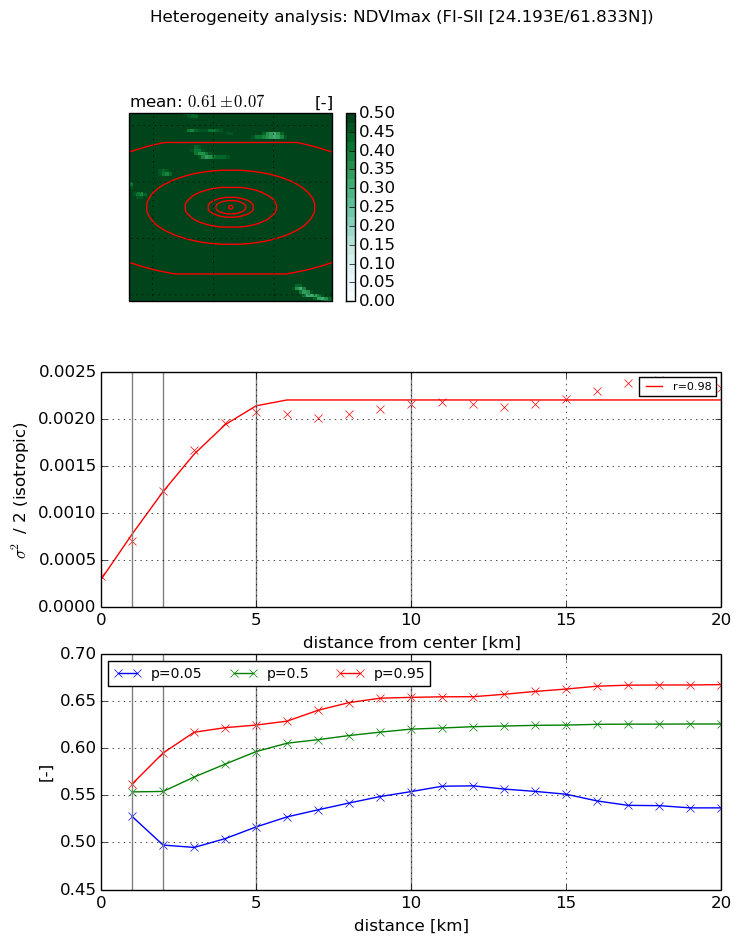
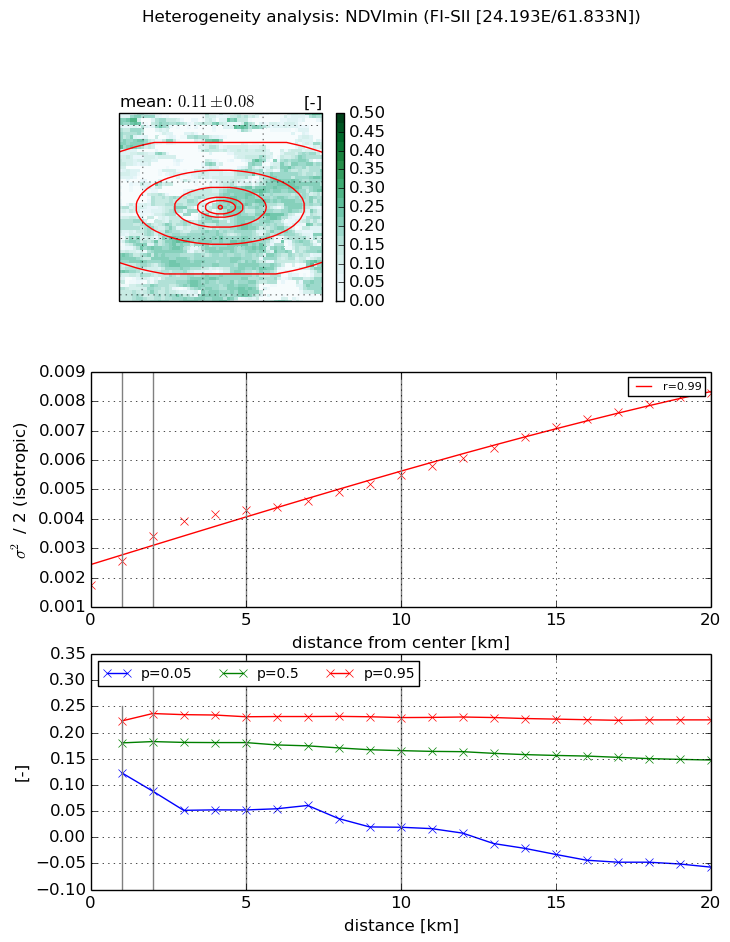
Heterogeneity analysis

The heterogeneity analysis provides information about the spatial and temporal heterogeneity of the site.

Topography


Roman et al. (2009) index


St

2.57750660236

Rcv

0.377354852548

Rse

0.0

Rst

0.193755646441

Rsv

-0.592805045302


Height range @ 1km [m]

20

Height range @ 2km [m]

20

Height range @ 5km [m]

30

Height range @ 10km [m]

-999

Height range @ 20km [m]

-999


Variance slope @ 1 km

79

Variance slope @ 2 km

54

Variance slope @ 5 km

16

Variance slope @ 10 km

-999

Variance slope @ 20 km

-999


NDVI (max. NDVI composite)


Roman et al. (2009) index


St

4.68854917517

Rcv

-0.117927109364

Rse

0.0

Rst

0.103031829885

Rsv

-0.418897845422


NDVI range @ 1km [-]

0.03

NDVI range @ 2km [-]

0.1

NDVI range @ 5km [-]

0.11

NDVI range @ 10km [-]

0.1

NDVI range @ 20km [-]

0.13


Variance slope @ 1 km

0.000373910515573

Variance slope @ 2 km

0.00045394028998

Variance slope @ 5 km

0.000369116064401

Variance slope @ 10 km

0.000163426834946

Variance slope @ 20 km

6.94976719963e-05


NDVI (min. NDVI composite)I


Roman et al. (2009) index


St

1.04633173136e-07

Rcv

-0.0930746046164

Rse

0.0

Rst

0.058854346565

Rsv

28671595.1947


NDVI range @ 1km [-]

0.1

NDVI range @ 2km [-]

0.15

NDVI range @ 5km [-]

0.18

NDVI range @ 10km [-]

0.21

NDVI range @ 20km [-]

0.28


NDVI slope @ 1 km

0.000809098043973

NDVI slope @ 2 km

0.000841991425853

NDVI slope @ 5 km

0.000515971640679

NDVI slope @ 10 km

0.00031964930708

NDVI slope @ 20 km

0.00029674545124


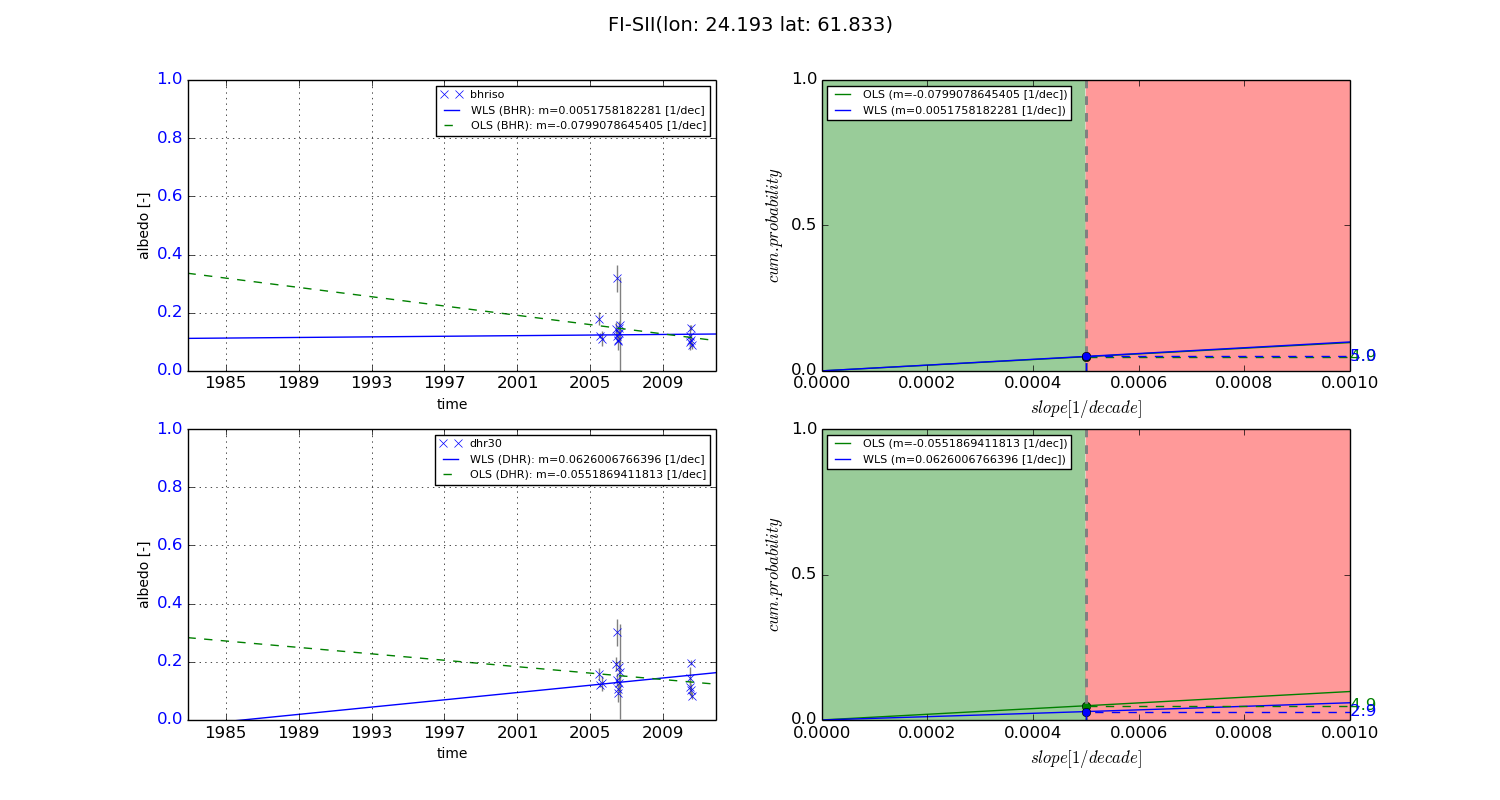
Temporal stability analysis

+000 deg (BHR)


BHR statistics

Temporal stability [1/decade]:


abs

rel


Weighted least square:

-99999.0


Ordinary least square:

-99999.0


Probabilities that GCOS criteria is met:

Weighted least square:

-99999.0 %

Ordinary least square:

-99999.0 %


DHR statistics

Temporal stability [1/decade]:


abs

rel


Weighted least square:

-99999.0


Ordinary least square:

-99999.0


Probabilities that GCOS criteria is met:

Weighted least square:

-99999.0 %

Ordinary least square:

-99999.0 %


+057/+063 deg (BHR)


BHR statistics

Temporal stability [1/decade]:


abs

rel


Weighted least square:

0.0051758182281


Ordinary least square:

-0.0799078645405


Probabilities that GCOS criteria is met:

Weighted least square:

5.0 %

Ordinary least square:

4.9 %


DHR statistics

Temporal stability [1/decade]:


abs

rel


Weighted least square:

0.0626006766396


Ordinary least square:

-0.0551869411813


Probabilities that GCOS criteria is met:

Weighted least square:

2.9 %

Ordinary least square:

4.9 %


Temporal anomaly analyis

The variance of the temporal anomalies provides an additional measure about the stability of the signal AFTER removal of the mean seasonal cylce.

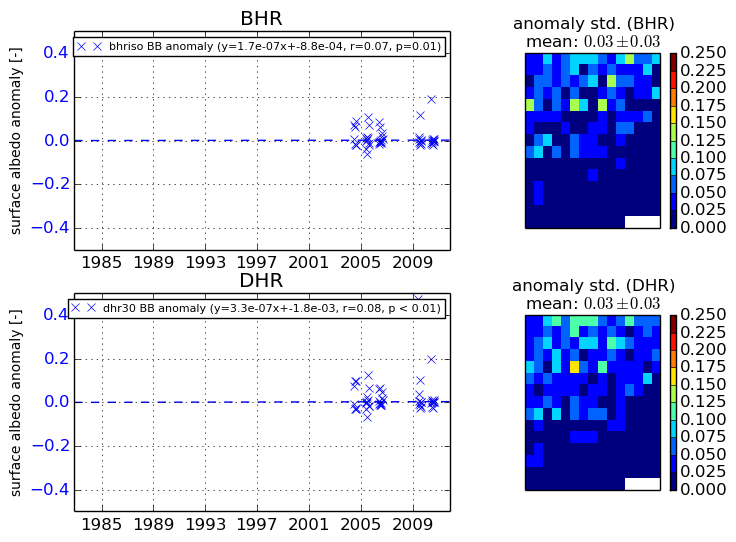
+000 deg


+057/+063 deg