FLOR_DE_ORO


Location

lon / lat [deg]: -61.0139 / -13.5531

Source network: AERONET


Geostationary surface albedo (GSA) data


“+000”


“+057/+063”


Landcover information (based on ESA CCI landcover data)


Landcover fractions @ 2km distance


Landcover fractions @ 20 km distance


Legend


Distance to open water bodies [km]:

0.78

Distance to urban areas [km]:

7.28


Radius: 1 km

Number of landcover classes:

5

Dominant landcover type:

110: Mosaic herbaceous cover (>50%) / tree and shrub (<50%)

Fraction of dominant landcover type [%]:

62.0


Radius: 2 km

Number of landcover classes:

6

Dominant landcover type:

110: Mosaic herbaceous cover (>50%) / tree and shrub (<50%)

Fraction of dominant landcover type [%]:

38.0


Radius: 5 km

Number of landcover classes:

6

Dominant landcover type:

50: Tree cover, broadleaved, evergreen, closed to open (>15%)

Fraction of dominant landcover type [%]:

53.0


Radius: 10 km

Number of landcover classes:

8

Dominant landcover type:

50: Tree cover, broadleaved, evergreen, closed to open (>15%)

Fraction of dominant landcover type [%]:

73.0


Radius: 20 km

Number of landcover classes:

7

Dominant landcover type:

50: Tree cover, broadleaved, evergreen, closed to open (>15%)

Fraction of dominant landcover type [%]:

82.0


Disturbances


Heterogeneity analysis

The heterogeneity analysis provides information about the spatial and temporal heterogeneity of the site.

Topography


Roman et al. (2009) index


St

1.62934092347

Rcv

0.843687111023

Rse

0.0

Rst

-1.90155215127e-06

Rsv

-0.997546272678


Height range @ 1km [m]

0

Height range @ 2km [m]

1

Height range @ 5km [m]

4

Height range @ 10km [m]

-999

Height range @ 20km [m]

-999


Variance slope @ 1 km

0

Variance slope @ 2 km

0

Variance slope @ 5 km

0

Variance slope @ 10 km

-999

Variance slope @ 20 km

-999


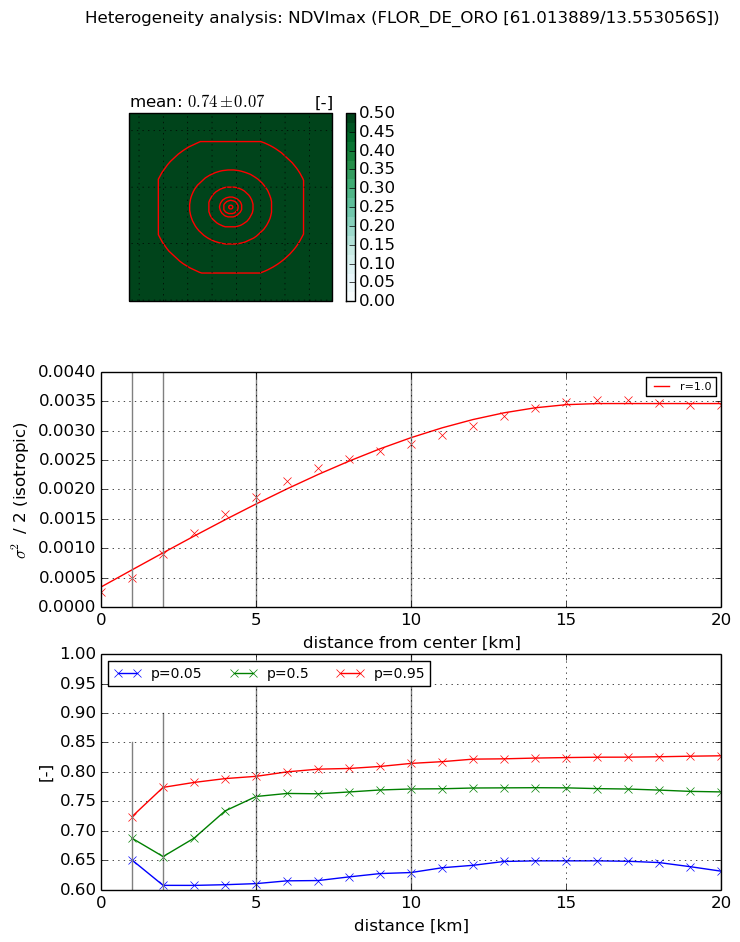
NDVI (max. NDVI composite)


Roman et al. (2009) index


St

7.83462344496

Rcv

-0.0225190153697

Rse

0.0

Rst

-0.123609524323

Rsv

0.236787119379


NDVI range @ 1km [-]

0.07

NDVI range @ 2km [-]

0.17

NDVI range @ 5km [-]

0.18

NDVI range @ 10km [-]

0.19

NDVI range @ 20km [-]

0.2


Variance slope @ 1 km

0.000238181158611

Variance slope @ 2 km

0.000317466902736

Variance slope @ 5 km

0.000332303961232

Variance slope @ 10 km

0.000261672644028

Variance slope @ 20 km

0.000160137312321


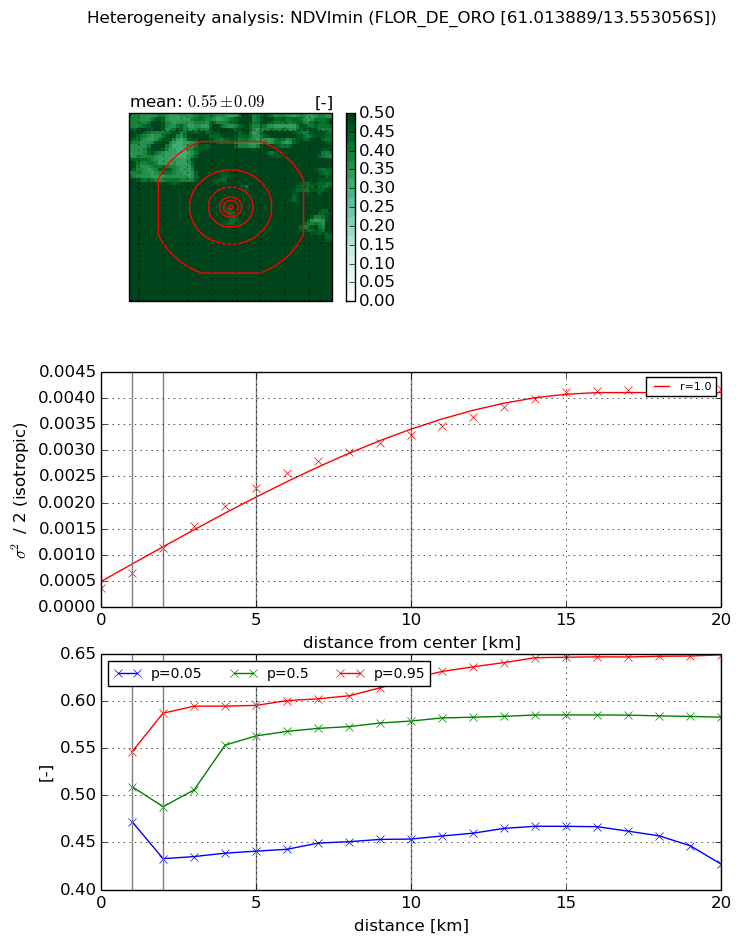
NDVI (min. NDVI composite)I


Roman et al. (2009) index


St

5.48330424787

Rcv

-0.0819775561005

Rse

0.0

Rst

-0.170756336553

Rsv

0.294381471438


NDVI range @ 1km [-]

0.07

NDVI range @ 2km [-]

0.15

NDVI range @ 5km [-]

0.15

NDVI range @ 10km [-]

0.17

NDVI range @ 20km [-]

0.22


NDVI slope @ 1 km

0.000291529286532

NDVI slope @ 2 km

0.000384708405395

NDVI slope @ 5 km

0.000394165126338

NDVI slope @ 10 km

0.000301548844726

NDVI slope @ 20 km

0.000186499135825


Temporal stability analysis

+000 deg (BHR)


BHR statistics

Temporal stability [1/decade]:


abs

rel


Weighted least square:

-99999.0


Ordinary least square:

-99999.0


Probabilities that GCOS criteria is met:

Weighted least square:

-99999.0 %

Ordinary least square:

-99999.0 %


DHR statistics

Temporal stability [1/decade]:


abs

rel


Weighted least square:

-99999.0


Ordinary least square:

-99999.0


Probabilities that GCOS criteria is met:

Weighted least square:

-99999.0 %

Ordinary least square:

-99999.0 %


+057/+063 deg (BHR)


BHR statistics

Temporal stability [1/decade]:


abs

rel


Weighted least square:

None


Ordinary least square:

None


Probabilities that GCOS criteria is met:

Weighted least square:

None %

Ordinary least square:

None %


DHR statistics

Temporal stability [1/decade]:


abs

rel


Weighted least square:

None


Ordinary least square:

None


Probabilities that GCOS criteria is met:

Weighted least square:

None %

Ordinary least square:

None %


Temporal anomaly analyis

The variance of the temporal anomalies provides an additional measure about the stability of the signal AFTER removal of the mean seasonal cylce.

+000 deg


+057/+063 deg


By continuing to use this website, you are giving consent to analytic cookies being used. For more information on how EUMETSAT uses data and how you can disable this, please view this web page: Analytics Cookie Policy