FONTAINEBLEAU


Location

lon / lat [deg]: 2.6803 / 48.4067

Source network: AERONET


Geostationary surface albedo (GSA) data


“+000”


“+057/+063”


Landcover information (based on ESA CCI landcover data)


Landcover fractions @ 2km distance


Landcover fractions @ 20 km distance


Legend


Distance to open water bodies [km]:

5.1

Distance to urban areas [km]:

0.29


Radius: 1 km

Number of landcover classes:

5

Dominant landcover type:

190: urban areas

Fraction of dominant landcover type [%]:

43.0


Radius: 2 km

Number of landcover classes:

6

Dominant landcover type:

190: urban areas

Fraction of dominant landcover type [%]:

37.0


Radius: 5 km

Number of landcover classes:

6

Dominant landcover type:

70: Tree cover, needleleaved, evergreen, closed to open (>15%)

Fraction of dominant landcover type [%]:

38.0


Radius: 10 km

Number of landcover classes:

5

Dominant landcover type:

60: Tree cover, broadleaved, decidous

Fraction of dominant landcover type [%]:

36.0


Radius: 20 km

Number of landcover classes:

5

Dominant landcover type:

10: cropland, rainfed

Fraction of dominant landcover type [%]:

48.0


Disturbances


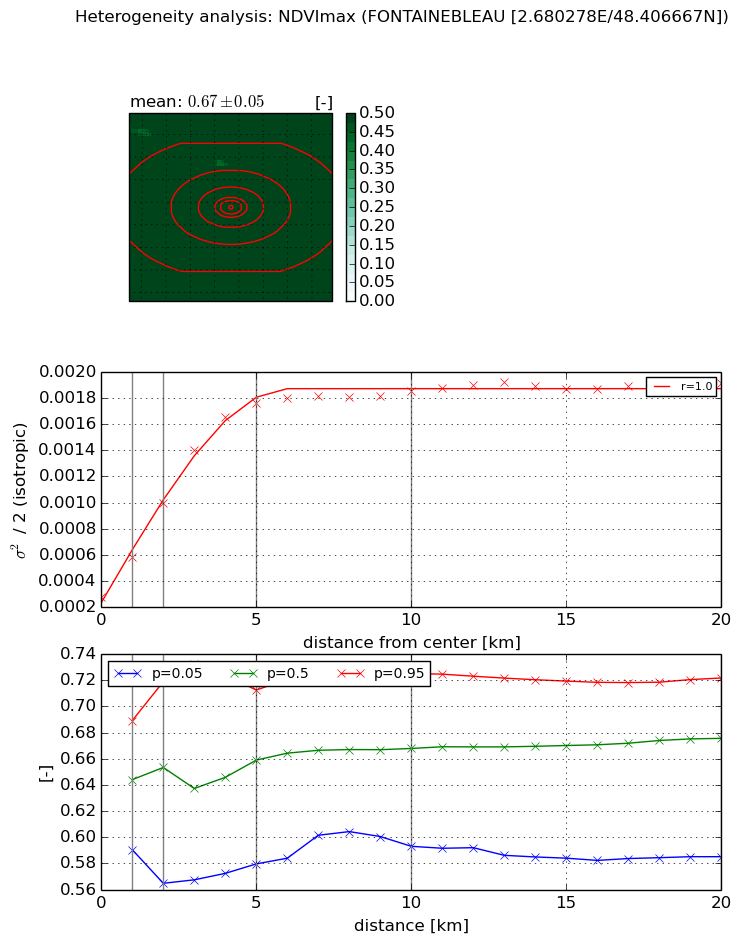
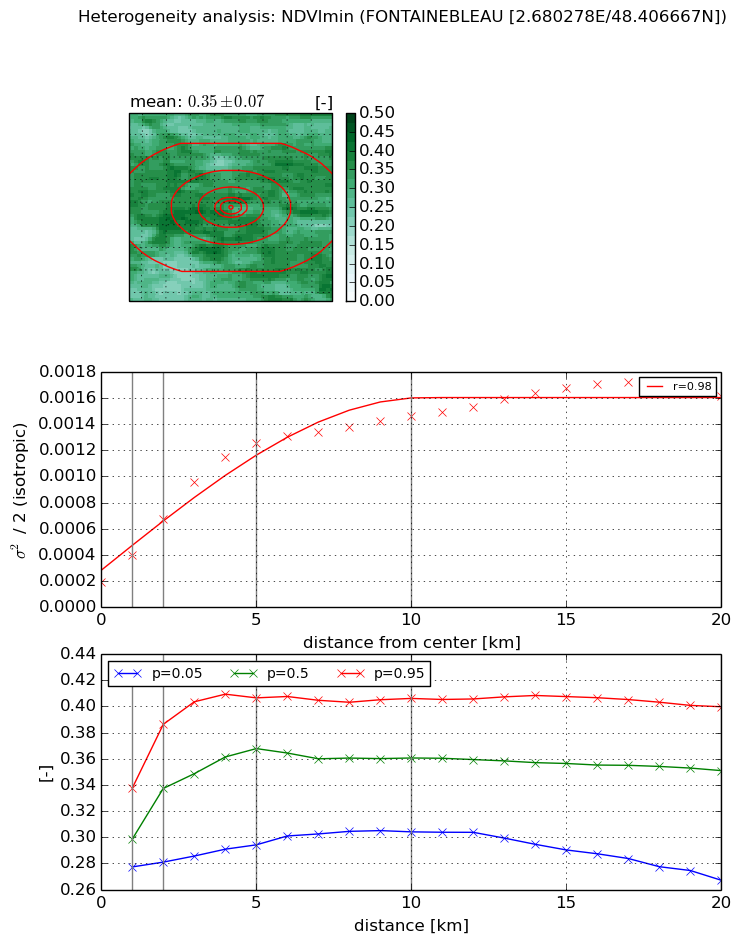
Heterogeneity analysis

The heterogeneity analysis provides information about the spatial and temporal heterogeneity of the site.

Topography


Roman et al. (2009) index


St

6.76244839791

Rcv

-0.108905848777

Rse

0.0

Rst

-0.0942285367045

Rsv

-0.240491920181


Height range @ 1km [m]

52

Height range @ 2km [m]

65

Height range @ 5km [m]

67

Height range @ 10km [m]

-999

Height range @ 20km [m]

-999


Variance slope @ 1 km

243

Variance slope @ 2 km

221

Variance slope @ 5 km

109

Variance slope @ 10 km

-999

Variance slope @ 20 km

-999


NDVI (max. NDVI composite)


Roman et al. (2009) index


St

4.23586509038

Rcv

-0.278791130414

Rse

0.0

Rst

0.146888413475

Rsv

-0.28255830977


NDVI range @ 1km [-]

0.1

NDVI range @ 2km [-]

0.15

NDVI range @ 5km [-]

0.13

NDVI range @ 10km [-]

0.13

NDVI range @ 20km [-]

0.14


Variance slope @ 1 km

0.000306769698267

Variance slope @ 2 km

0.00036057244737

Variance slope @ 5 km

0.000316665013303

Variance slope @ 10 km

0.000147727287666

Variance slope @ 20 km

5.46289375315e-05


NDVI (min. NDVI composite)I


Roman et al. (2009) index


St

9.45019441112

Rcv

-0.178590121363

Rse

0.0

Rst

-0.0557304847685

Rsv

0.0831331804773


NDVI range @ 1km [-]

0.06

NDVI range @ 2km [-]

0.11

NDVI range @ 5km [-]

0.11

NDVI range @ 10km [-]

0.1

NDVI range @ 20km [-]

0.13


NDVI slope @ 1 km

0.000204733485778

NDVI slope @ 2 km

0.000242030294528

NDVI slope @ 5 km

0.000223575335774

NDVI slope @ 10 km

0.000122293293527

NDVI slope @ 20 km

6.07934811288e-05


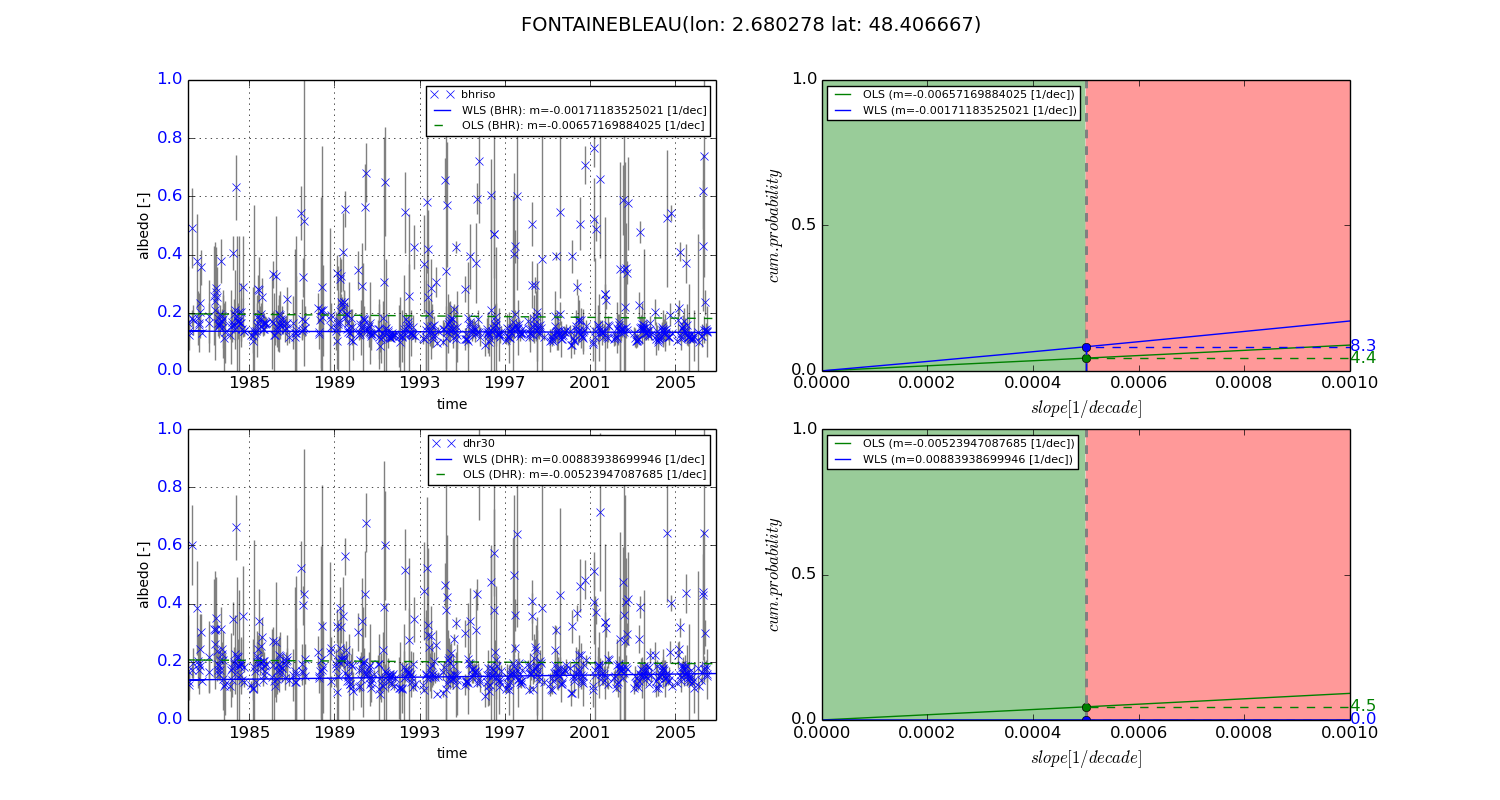
Temporal stability analysis

+000 deg (BHR)


BHR statistics

Temporal stability [1/decade]:


abs

rel


Weighted least square:

-0.00171183525021


Ordinary least square:

-0.00657169884025


Probabilities that GCOS criteria is met:

Weighted least square:

8.3 %

Ordinary least square:

4.4 %


DHR statistics

Temporal stability [1/decade]:


abs

rel


Weighted least square:

0.00883938699946


Ordinary least square:

-0.00523947087685


Probabilities that GCOS criteria is met:

Weighted least square:

0.0 %

Ordinary least square:

4.5 %


+057/+063 deg (BHR)


BHR statistics

Temporal stability [1/decade]:


abs

rel


Weighted least square:

-99999.0


Ordinary least square:

-99999.0


Probabilities that GCOS criteria is met:

Weighted least square:

-99999.0 %

Ordinary least square:

-99999.0 %


DHR statistics

Temporal stability [1/decade]:


abs

rel


Weighted least square:

-99999.0


Ordinary least square:

-99999.0


Probabilities that GCOS criteria is met:

Weighted least square:

-99999.0 %

Ordinary least square:

-99999.0 %


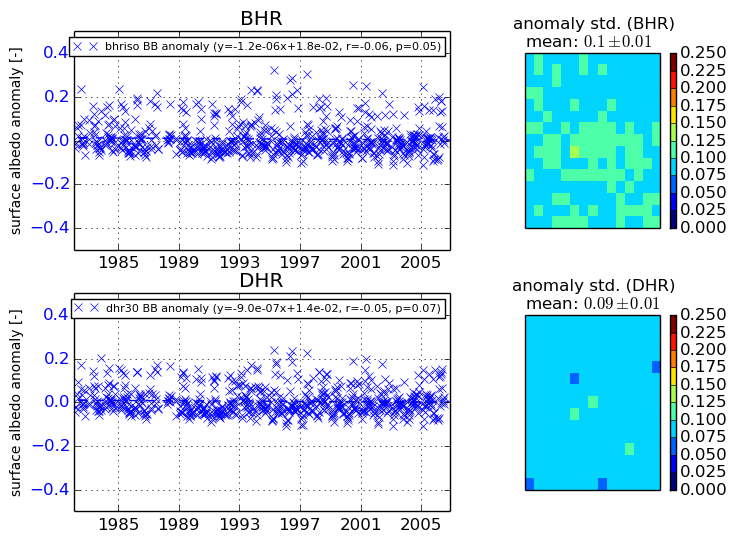
Temporal anomaly analyis

The variance of the temporal anomalies provides an additional measure about the stability of the signal AFTER removal of the mean seasonal cylce.
+000 deg


+057/+063 deg


By continuing to use this website, you are giving consent to analytic cookies being used. For more information on how EUMETSAT uses data and how you can disable this, please view this web page: Analytics Cookie Policy