FORT_MCKAY


Location

lon / lat [deg]: -111.64 / 57.1835

Source network: AERONET


Geostationary surface albedo (GSA) data


“+000”


“+057/+063”


Landcover information (based on ESA CCI landcover data)


Landcover fractions @ 2km distance


Landcover fractions @ 20 km distance


Legend


Distance to open water bodies [km]:

0.52

Distance to urban areas [km]:

47.65


Radius: 1 km

Number of landcover classes:

5

Dominant landcover type:

150: Sparse vegetation (tree, shrub, herbaceous cover) (<15%)

Fraction of dominant landcover type [%]:

52.0


Radius: 2 km

Number of landcover classes:

5

Dominant landcover type:

70: Tree cover, needleleaved, evergreen, closed to open (>15%)

Fraction of dominant landcover type [%]:

65.0


Radius: 5 km

Number of landcover classes:

5

Dominant landcover type:

70: Tree cover, needleleaved, evergreen, closed to open (>15%)

Fraction of dominant landcover type [%]:

73.0


Radius: 10 km

Number of landcover classes:

6

Dominant landcover type:

70: Tree cover, needleleaved, evergreen, closed to open (>15%)

Fraction of dominant landcover type [%]:

75.0


Radius: 20 km

Number of landcover classes:

7

Dominant landcover type:

70: Tree cover, needleleaved, evergreen, closed to open (>15%)

Fraction of dominant landcover type [%]:

62.0


Disturbances


Heterogeneity analysis

The heterogeneity analysis provides information about the spatial and temporal heterogeneity of the site.

Topography


Roman et al. (2009) index


St

6.5620006741

Rcv

0.0506744103059

Rse

0.0

Rst

-0.00604303387495

Rsv

0.400460198583


Height range @ 1km [m]

58

Height range @ 2km [m]

65

Height range @ 5km [m]

82

Height range @ 10km [m]

-999

Height range @ 20km [m]

-999


Variance slope @ 1 km

178

Variance slope @ 2 km

182

Variance slope @ 5 km

155

Variance slope @ 10 km

-999

Variance slope @ 20 km

-999


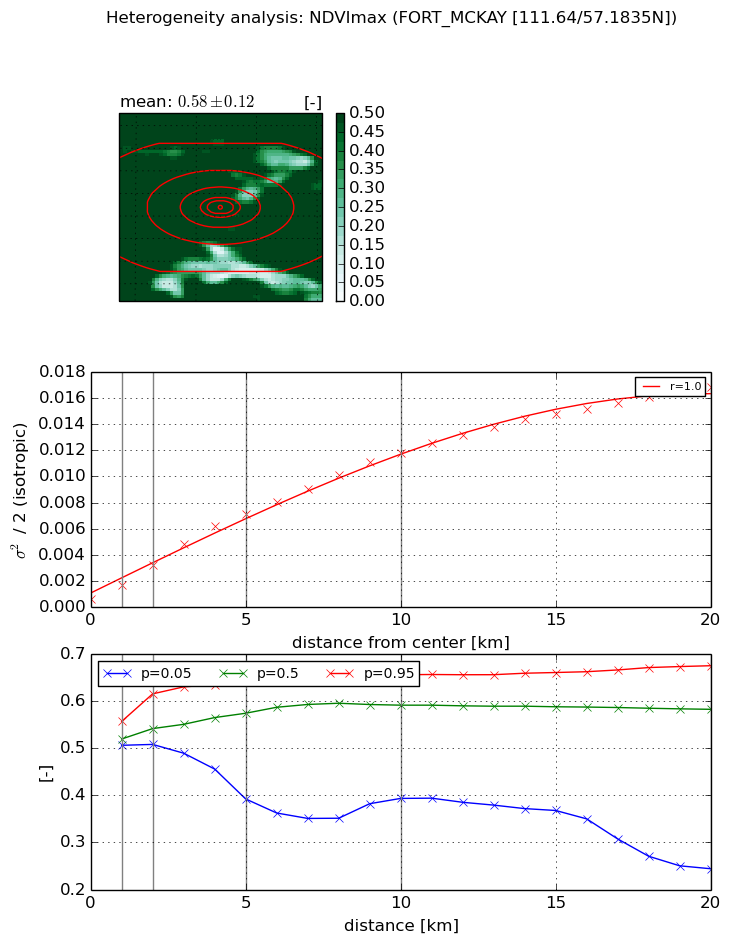
NDVI (max. NDVI composite)


Roman et al. (2009) index


St

3.94941441567

Rcv

0.570759695255

Rse

0.0

Rst

-1.48240472385e-08

Rsv

-0.188846571828


NDVI range @ 1km [-]

0.05

NDVI range @ 2km [-]

0.11

NDVI range @ 5km [-]

0.26

NDVI range @ 10km [-]

0.26

NDVI range @ 20km [-]

0.43


Variance slope @ 1 km

0.00109899642768

Variance slope @ 2 km

0.00129217987643

Variance slope @ 5 km

0.00135951573952

Variance slope @ 10 km

0.00112913392095

Variance slope @ 20 km

0.000796753043443


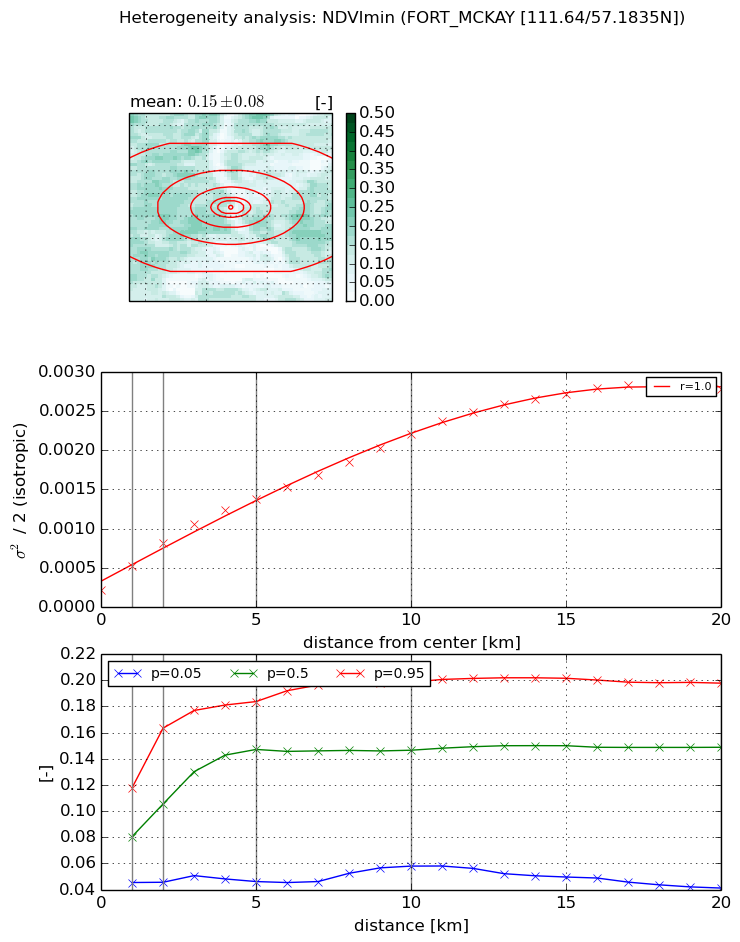
NDVI (min. NDVI composite)I


Roman et al. (2009) index


St

4.56727200356

Rcv

0.0142102160929

Rse

0.0

Rst

0.555645347736

Rsv

-0.0869916740111


NDVI range @ 1km [-]

0.07

NDVI range @ 2km [-]

0.12

NDVI range @ 5km [-]

0.14

NDVI range @ 10km [-]

0.14

NDVI range @ 20km [-]

0.16


NDVI slope @ 1 km

0.00031085562642

NDVI slope @ 2 km

0.000302910002828

NDVI slope @ 5 km

0.000235493284174

NDVI slope @ 10 km

0.000187489211801

NDVI slope @ 20 km

0.000129236625056


Temporal stability analysis

+000 deg (BHR)


BHR statistics

Temporal stability [1/decade]:


abs

rel


Weighted least square:

None


Ordinary least square:

None


Probabilities that GCOS criteria is met:

Weighted least square:

None %

Ordinary least square:

None %


DHR statistics

Temporal stability [1/decade]:


abs

rel


Weighted least square:

None


Ordinary least square:

None


Probabilities that GCOS criteria is met:

Weighted least square:

None %

Ordinary least square:

None %


+057/+063 deg (BHR)


BHR statistics

Temporal stability [1/decade]:


abs

rel


Weighted least square:

None


Ordinary least square:

None


Probabilities that GCOS criteria is met:

Weighted least square:

None %

Ordinary least square:

None %


DHR statistics

Temporal stability [1/decade]:


abs

rel


Weighted least square:

None


Ordinary least square:

None


Probabilities that GCOS criteria is met:

Weighted least square:

None %

Ordinary least square:

None %


Temporal anomaly analyis

The variance of the temporal anomalies provides an additional measure about the stability of the signal AFTER removal of the mean seasonal cylce.

+000 deg


+057/+063 deg