FORT_MCMURRAY


Location

lon / lat [deg]: -111.4761 / 56.7523

Source network: AERONET


Geostationary surface albedo (GSA) data


“+000”


“+057/+063”


Landcover information (based on ESA CCI landcover data)


Landcover fractions @ 2km distance


Landcover fractions @ 20 km distance


Legend


Distance to open water bodies [km]:

4.54

Distance to urban areas [km]:

0.19


Radius: 1 km

Number of landcover classes:

6

Dominant landcover type:

190: urban areas

Fraction of dominant landcover type [%]:

71.0


Radius: 2 km

Number of landcover classes:

8

Dominant landcover type:

190: urban areas

Fraction of dominant landcover type [%]:

43.0


Radius: 5 km

Number of landcover classes:

9

Dominant landcover type:

70: Tree cover, needleleaved, evergreen, closed to open (>15%)

Fraction of dominant landcover type [%]:

46.0


Radius: 10 km

Number of landcover classes:

11

Dominant landcover type:

70: Tree cover, needleleaved, evergreen, closed to open (>15%)

Fraction of dominant landcover type [%]:

67.0


Radius: 20 km

Number of landcover classes:

10

Dominant landcover type:

70: Tree cover, needleleaved, evergreen, closed to open (>15%)

Fraction of dominant landcover type [%]:

77.0


Disturbances


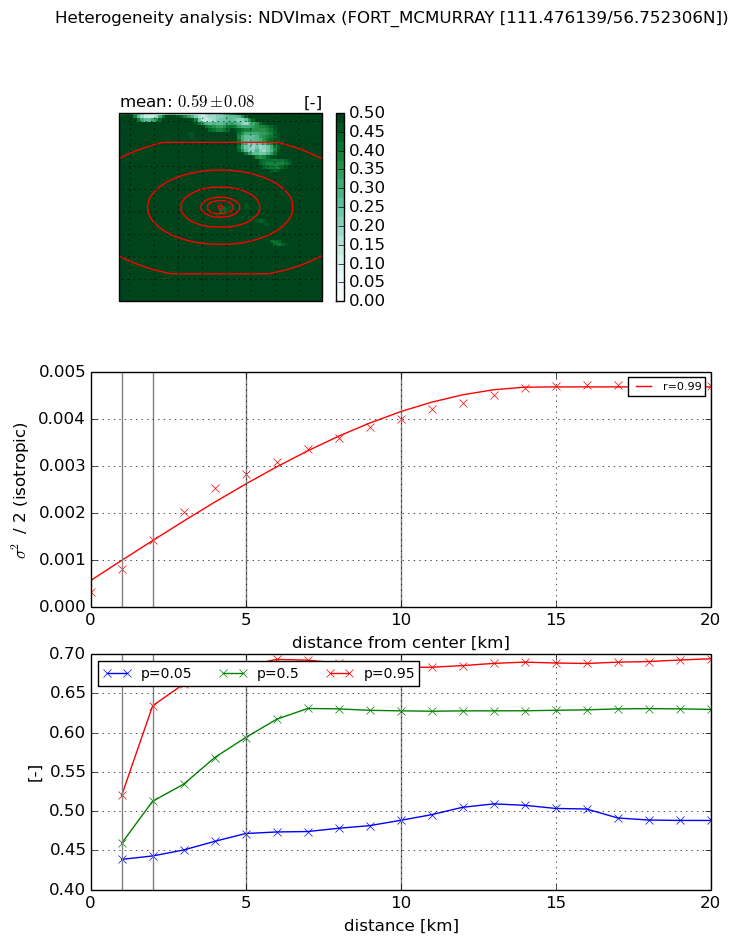
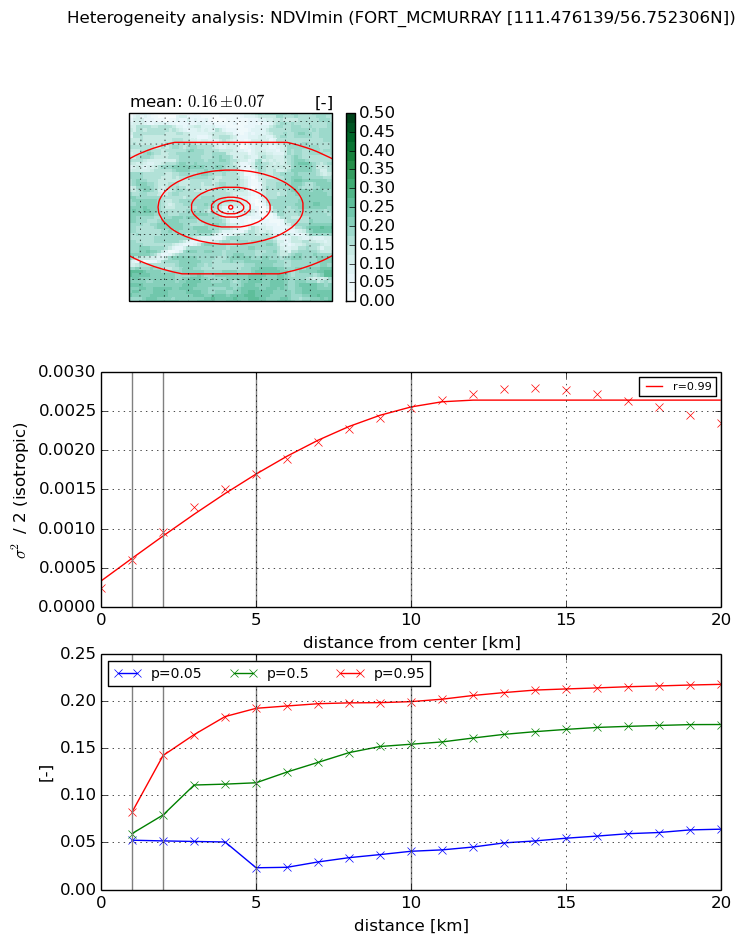
Heterogeneity analysis

The heterogeneity analysis provides information about the spatial and temporal heterogeneity of the site.

Topography


Roman et al. (2009) index


St

1.01792731332

Rcv

1.97628028103

Rse

0.0

Rst

-1.96800771224e-06

Rsv

-0.9708829962


Height range @ 1km [m]

13

Height range @ 2km [m]

27

Height range @ 5km [m]

150

Height range @ 10km [m]

-999

Height range @ 20km [m]

-999


Variance slope @ 1 km

377

Variance slope @ 2 km

391

Variance slope @ 5 km

401

Variance slope @ 10 km

-999

Variance slope @ 20 km

-999


NDVI (max. NDVI composite)


Roman et al. (2009) index


St

6.36252929892

Rcv

0.0432637732271

Rse

0.0

Rst

0.0376562519318

Rsv

0.390590573702


NDVI range @ 1km [-]

0.08

NDVI range @ 2km [-]

0.19

NDVI range @ 5km [-]

0.21

NDVI range @ 10km [-]

0.2

NDVI range @ 20km [-]

0.21


Variance slope @ 1 km

0.000493679221863

Variance slope @ 2 km

0.00054946479011

Variance slope @ 5 km

0.000522822359119

Variance slope @ 10 km

0.000365377589395

Variance slope @ 20 km

0.000206906840603


NDVI (min. NDVI composite)I


Roman et al. (2009) index


St

4.24398232816

Rcv

0.473738526988

Rse

0.0

Rst

8.61311398964e-09

Rsv

0.233144709433


NDVI range @ 1km [-]

0.03

NDVI range @ 2km [-]

0.09

NDVI range @ 5km [-]

0.17

NDVI range @ 10km [-]

0.16

NDVI range @ 20km [-]

0.15


NDVI slope @ 1 km

0.000359878251664

NDVI slope @ 2 km

0.000358107529967

NDVI slope @ 5 km

0.000292825949573

NDVI slope @ 10 km

0.000224322541364

NDVI slope @ 20 km

0.000102986728882


Temporal stability analysis

+000 deg (BHR)


BHR statistics

Temporal stability [1/decade]:


abs

rel


Weighted least square:

None


Ordinary least square:

None


Probabilities that GCOS criteria is met:

Weighted least square:

None %

Ordinary least square:

None %


DHR statistics

Temporal stability [1/decade]:


abs

rel


Weighted least square:

None


Ordinary least square:

None


Probabilities that GCOS criteria is met:

Weighted least square:

None %

Ordinary least square:

None %


+057/+063 deg (BHR)


BHR statistics

Temporal stability [1/decade]:


abs

rel


Weighted least square:

None


Ordinary least square:

None


Probabilities that GCOS criteria is met:

Weighted least square:

None %

Ordinary least square:

None %


DHR statistics

Temporal stability [1/decade]:


abs

rel


Weighted least square:

None


Ordinary least square:

None


Probabilities that GCOS criteria is met:

Weighted least square:

None %

Ordinary least square:

None %


Temporal anomaly analyis

The variance of the temporal anomalies provides an additional measure about the stability of the signal AFTER removal of the mean seasonal cylce.

+000 deg


+057/+063 deg