FORT_PECK


Location

lon / lat [deg]: -105.1018 / 48.308

Source network: SURFRAD


Geostationary surface albedo (GSA) data


“+000”


“+057/+063”


Landcover information (based on ESA CCI landcover data)


Landcover fractions @ 2km distance


Landcover fractions @ 20 km distance


Legend


Distance to open water bodies [km]:

9.75

Distance to urban areas [km]:

22.53


Radius: 1 km

Number of landcover classes:

1

Dominant landcover type:

130: grassland

Fraction of dominant landcover type [%]:

100.0


Radius: 2 km

Number of landcover classes:

1

Dominant landcover type:

130: grassland

Fraction of dominant landcover type [%]:

99.0


Radius: 5 km

Number of landcover classes:

2

Dominant landcover type:

130: grassland

Fraction of dominant landcover type [%]:

81.0


Radius: 10 km

Number of landcover classes:

2

Dominant landcover type:

130: grassland

Fraction of dominant landcover type [%]:

65.0


Radius: 20 km

Number of landcover classes:

2

Dominant landcover type:

130: grassland

Fraction of dominant landcover type [%]:

66.0


Disturbances


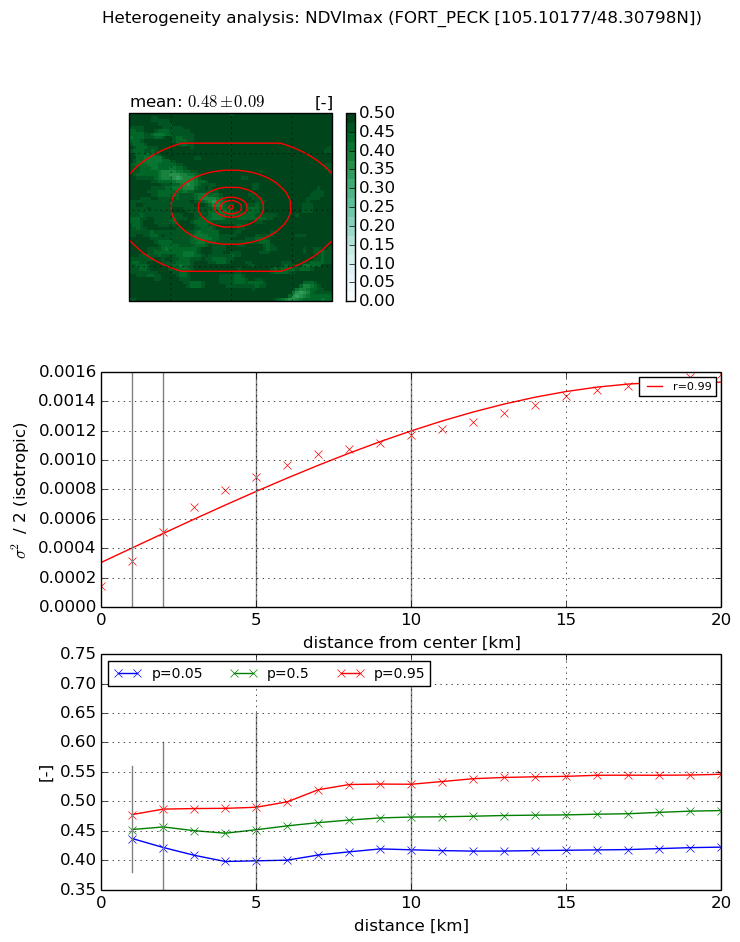
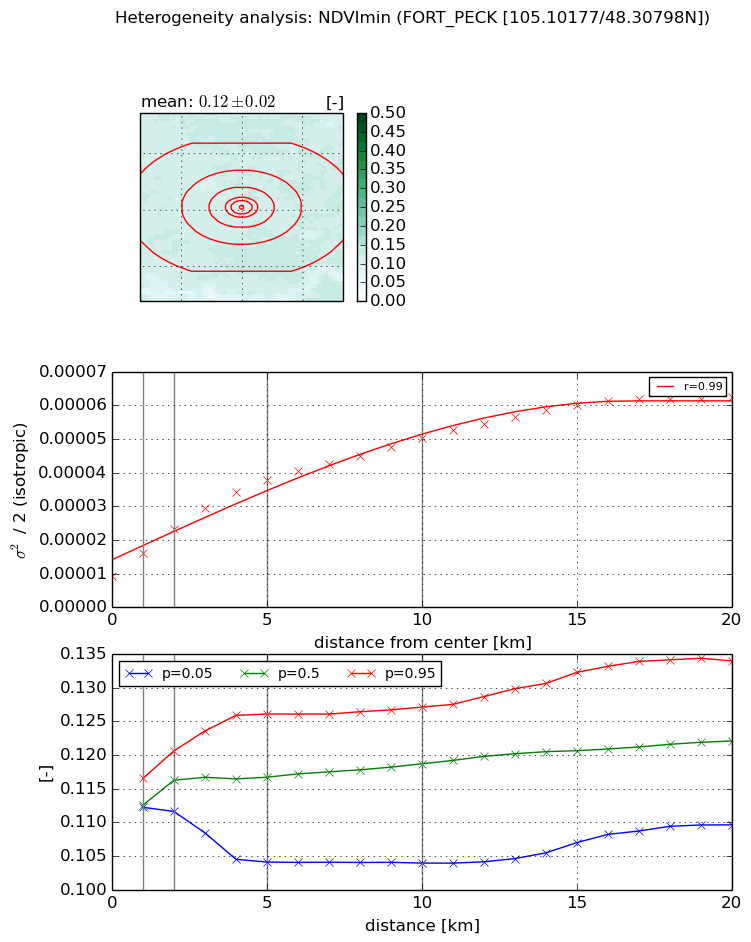
Heterogeneity analysis

The heterogeneity analysis provides information about the spatial and temporal heterogeneity of the site.

Topography


Roman et al. (2009) index


St

3.78896195349

Rcv

0.455771639952

Rse

0.0

Rst

-0.0393744387914

Rsv

0.296627509069


Height range @ 1km [m]

25

Height range @ 2km [m]

44

Height range @ 5km [m]

111

Height range @ 10km [m]

-999

Height range @ 20km [m]

-999


Variance slope @ 1 km

165

Variance slope @ 2 km

223

Variance slope @ 5 km

334

Variance slope @ 10 km

-999

Variance slope @ 20 km

-999


NDVI (max. NDVI composite)


Roman et al. (2009) index


St

17.2617022254

Rcv

0.0309593467488

Rse

0.0

Rst

-0.00431343015389

Rsv

-0.13852236571


NDVI range @ 1km [-]

0.04

NDVI range @ 2km [-]

0.07

NDVI range @ 5km [-]

0.09

NDVI range @ 10km [-]

0.11

NDVI range @ 20km [-]

0.12


Variance slope @ 1 km

0.000169612962068

Variance slope @ 2 km

0.000183491085828

Variance slope @ 5 km

0.000153059288708

Variance slope @ 10 km

9.9648703023e-05

Variance slope @ 20 km

6.42745419438e-05


NDVI (min. NDVI composite)I


Roman et al. (2009) index


St

nan

Rcv

nan

Rse

nan

Rst

nan

Rsv

nan


NDVI range @ 1km [-]

0.0

NDVI range @ 2km [-]

0.01

NDVI range @ 5km [-]

0.02

NDVI range @ 10km [-]

0.02

NDVI range @ 20km [-]

0.02


NDVI slope @ 1 km

6.84999961762e-06

NDVI slope @ 2 km

7.06902036272e-06

NDVI slope @ 5 km

5.81849703767e-06

NDVI slope @ 10 km

3.89517379437e-06

NDVI slope @ 20 km

2.45761880847e-06


Temporal stability analysis

+000 deg (BHR)


BHR statistics

Temporal stability [1/decade]:


abs

rel


Weighted least square:

None


Ordinary least square:

None


Probabilities that GCOS criteria is met:

Weighted least square:

None %

Ordinary least square:

None %


DHR statistics

Temporal stability [1/decade]:


abs

rel


Weighted least square:

None


Ordinary least square:

None


Probabilities that GCOS criteria is met:

Weighted least square:

None %

Ordinary least square:

None %


+057/+063 deg (BHR)


BHR statistics

Temporal stability [1/decade]:


abs

rel


Weighted least square:

None


Ordinary least square:

None


Probabilities that GCOS criteria is met:

Weighted least square:

None %

Ordinary least square:

None %


DHR statistics

Temporal stability [1/decade]:


abs

rel


Weighted least square:

None


Ordinary least square:

None


Probabilities that GCOS criteria is met:

Weighted least square:

None %

Ordinary least square:

None %


Temporal anomaly analyis

The variance of the temporal anomalies provides an additional measure about the stability of the signal AFTER removal of the mean seasonal cylce.

+000 deg


+057/+063 deg