FR-AUR


Location

lon / lat [deg]: 1.1078 / 43.5494

Source network: FLUXNET


Geostationary surface albedo (GSA) data


“+000”


“+057/+063”


Landcover information (based on ESA CCI landcover data)


Landcover fractions @ 2km distance


Landcover fractions @ 20 km distance


Legend


Distance to open water bodies [km]:

5.76

Distance to urban areas [km]:

3.32


Radius: 1 km

Number of landcover classes:

3

Dominant landcover type:

10: cropland, rainfed

Fraction of dominant landcover type [%]:

73.0


Radius: 2 km

Number of landcover classes:

3

Dominant landcover type:

10: cropland, rainfed

Fraction of dominant landcover type [%]:

93.0


Radius: 5 km

Number of landcover classes:

2

Dominant landcover type:

10: cropland, rainfed

Fraction of dominant landcover type [%]:

95.0


Radius: 10 km

Number of landcover classes:

3

Dominant landcover type:

10: cropland, rainfed

Fraction of dominant landcover type [%]:

92.0


Radius: 20 km

Number of landcover classes:

3

Dominant landcover type:

10: cropland, rainfed

Fraction of dominant landcover type [%]:

88.0


Disturbances


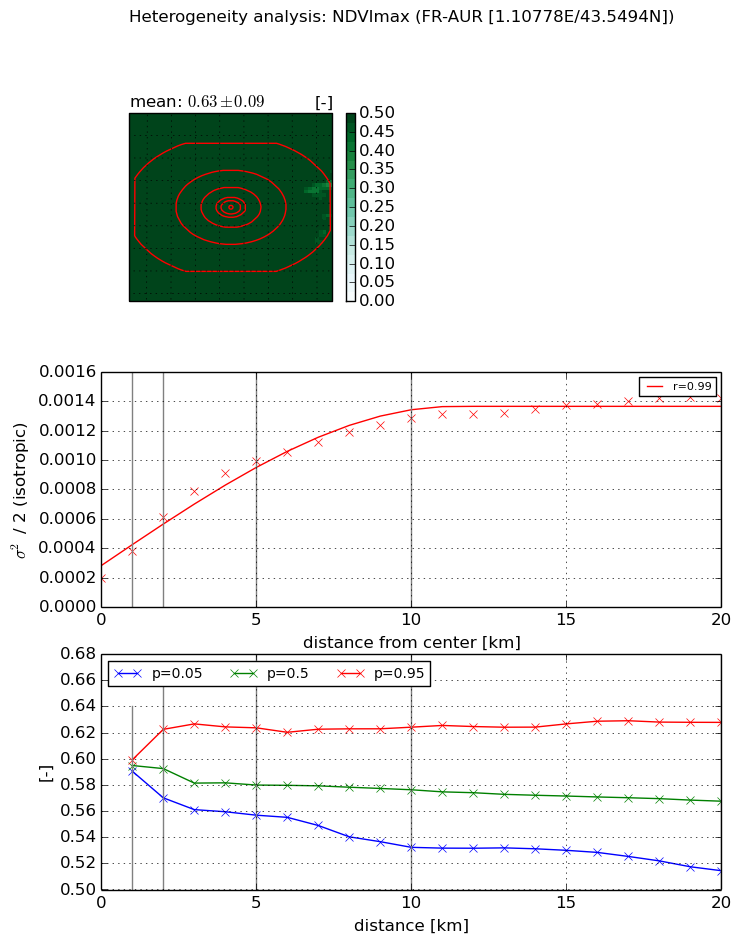
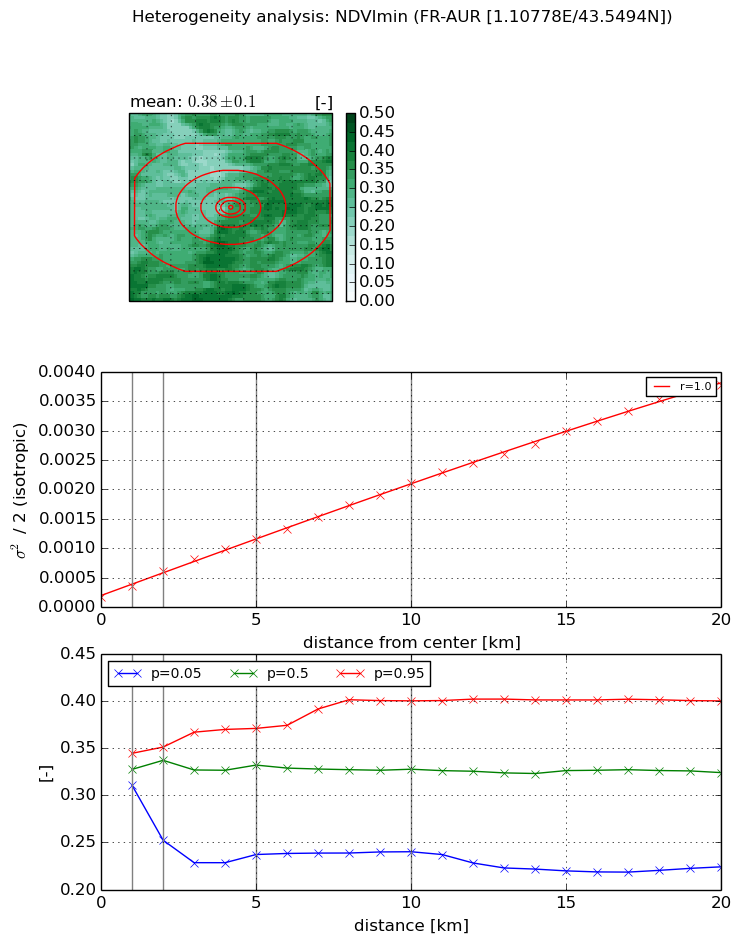
Heterogeneity analysis

The heterogeneity analysis provides information about the spatial and temporal heterogeneity of the site.

Topography


Roman et al. (2009) index


St

5.49172336298

Rcv

0.371120106737

Rse

0.0

Rst

0.0702813880571

Rsv

-0.104875111238


Height range @ 1km [m]

63

Height range @ 2km [m]

75

Height range @ 5km [m]

121

Height range @ 10km [m]

-999

Height range @ 20km [m]

-999


Variance slope @ 1 km

367

Variance slope @ 2 km

335

Variance slope @ 5 km

359

Variance slope @ 10 km

-999

Variance slope @ 20 km

-999


NDVI (max. NDVI composite)


Roman et al. (2009) index


St

5.67283047067

Rcv

-0.0445732676982

Rse

0.0

Rst

0.121747100835

Rsv

-0.362516164748


NDVI range @ 1km [-]

0.01

NDVI range @ 2km [-]

0.05

NDVI range @ 5km [-]

0.07

NDVI range @ 10km [-]

0.09

NDVI range @ 20km [-]

0.11


Variance slope @ 1 km

0.000182935706876

Variance slope @ 2 km

0.000205928841778

Variance slope @ 5 km

0.00016393337786

Variance slope @ 10 km

0.000103699017337

Variance slope @ 20 km

5.10850007958e-05


NDVI (min. NDVI composite)I


Roman et al. (2009) index


St

2.4989420873

Rcv

0.104513436828

Rse

0.0

Rst

-0.0959946134647

Rsv

-0.999999962775


NDVI range @ 1km [-]

0.03

NDVI range @ 2km [-]

0.1

NDVI range @ 5km [-]

0.13

NDVI range @ 10km [-]

0.16

NDVI range @ 20km [-]

0.18


NDVI slope @ 1 km

0.000186512286468

NDVI slope @ 2 km

0.000216378847345

NDVI slope @ 5 km

0.000200369484266

NDVI slope @ 10 km

0.000191082466997

NDVI slope @ 20 km

0.000181822618922


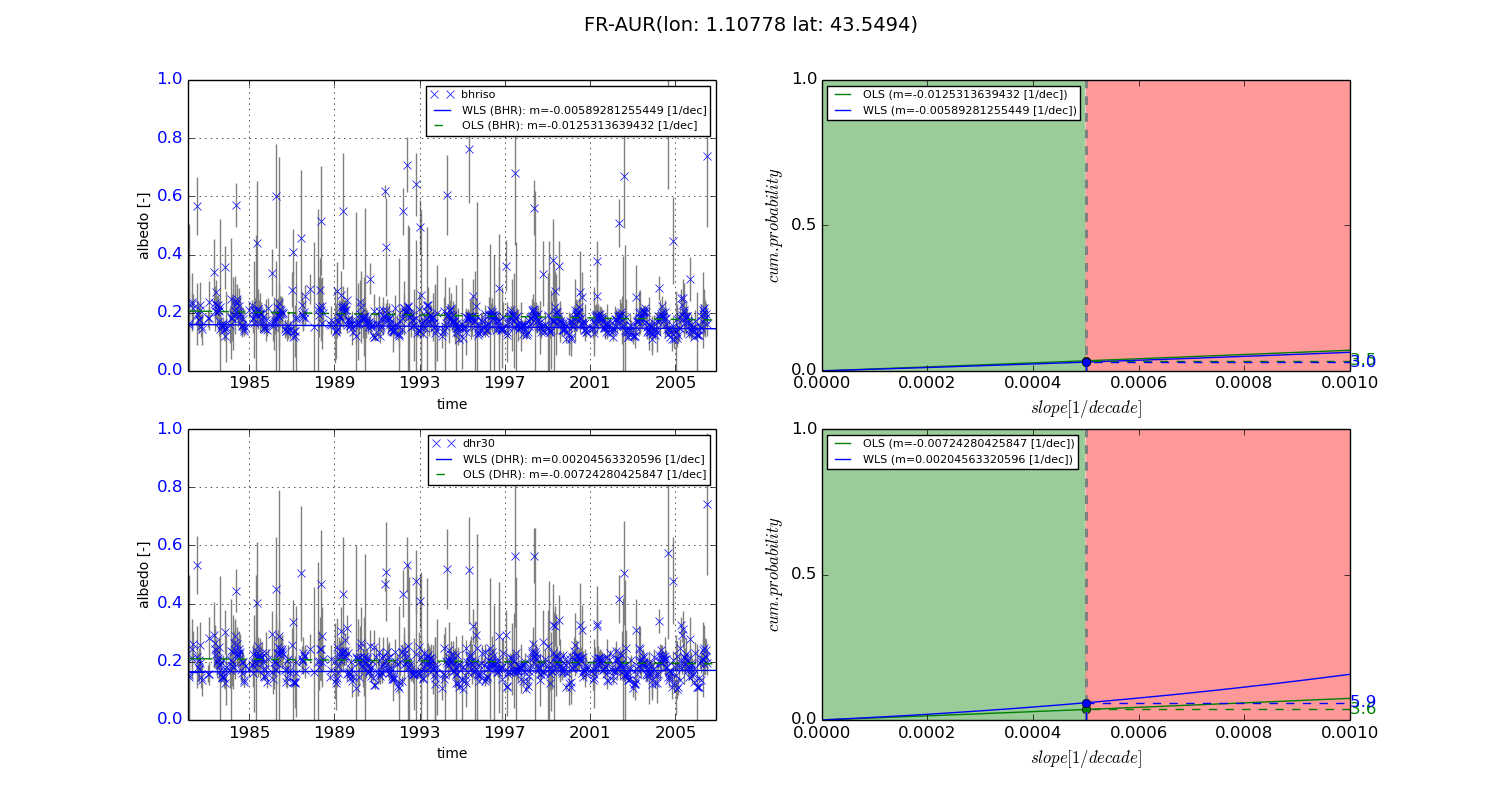
Temporal stability analysis

+000 deg (BHR)


BHR statistics

Temporal stability [1/decade]:


abs

rel


Weighted least square:

-0.00589281255449


Ordinary least square:

-0.0125313639432


Probabilities that GCOS criteria is met:

Weighted least square:

3.0 %

Ordinary least square:

3.5 %


DHR statistics

Temporal stability [1/decade]:


abs

rel


Weighted least square:

0.00204563320596


Ordinary least square:

-0.00724280425847


Probabilities that GCOS criteria is met:

Weighted least square:

5.9 %

Ordinary least square:

3.6 %


+057/+063 deg (BHR)


BHR statistics

Temporal stability [1/decade]:


abs

rel


Weighted least square:

-99999.0


Ordinary least square:

-99999.0


Probabilities that GCOS criteria is met:

Weighted least square:

-99999.0 %

Ordinary least square:

-99999.0 %


DHR statistics

Temporal stability [1/decade]:


abs

rel


Weighted least square:

-99999.0


Ordinary least square:

-99999.0


Probabilities that GCOS criteria is met:

Weighted least square:

-99999.0 %

Ordinary least square:

-99999.0 %


Temporal anomaly analyis

The variance of the temporal anomalies provides an additional measure about the stability of the signal AFTER removal of the mean seasonal cylce.
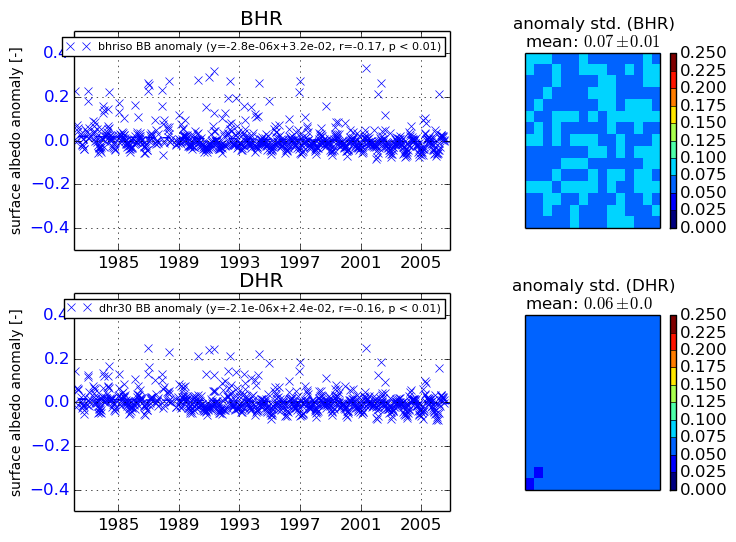
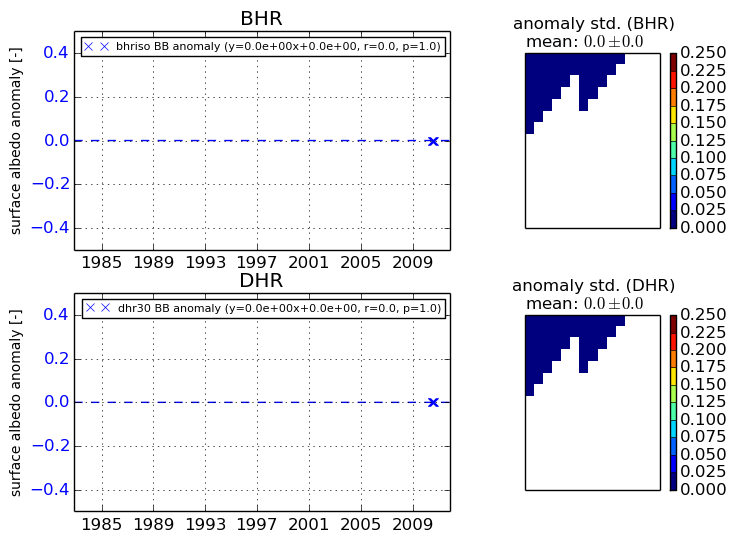
+000 deg


+057/+063 deg