FR-FON


Location

lon / lat [deg]: 2.7802 / 48.4763

Source network: FLUXNET


Geostationary surface albedo (GSA) data


“+000”


“+057/+063”


Landcover information (based on ESA CCI landcover data)


Landcover fractions @ 2km distance


Landcover fractions @ 20 km distance


Legend


Distance to open water bodies [km]:

1.45

Distance to urban areas [km]:

0.89


Radius: 1 km

Number of landcover classes:

3

Dominant landcover type:

60: Tree cover, broadleaved, decidous

Fraction of dominant landcover type [%]:

81.0


Radius: 2 km

Number of landcover classes:

3

Dominant landcover type:

60: Tree cover, broadleaved, decidous

Fraction of dominant landcover type [%]:

55.0


Radius: 5 km

Number of landcover classes:

4

Dominant landcover type:

10: cropland, rainfed

Fraction of dominant landcover type [%]:

55.0


Radius: 10 km

Number of landcover classes:

6

Dominant landcover type:

10: cropland, rainfed

Fraction of dominant landcover type [%]:

39.0


Radius: 20 km

Number of landcover classes:

6

Dominant landcover type:

10: cropland, rainfed

Fraction of dominant landcover type [%]:

50.0


Disturbances


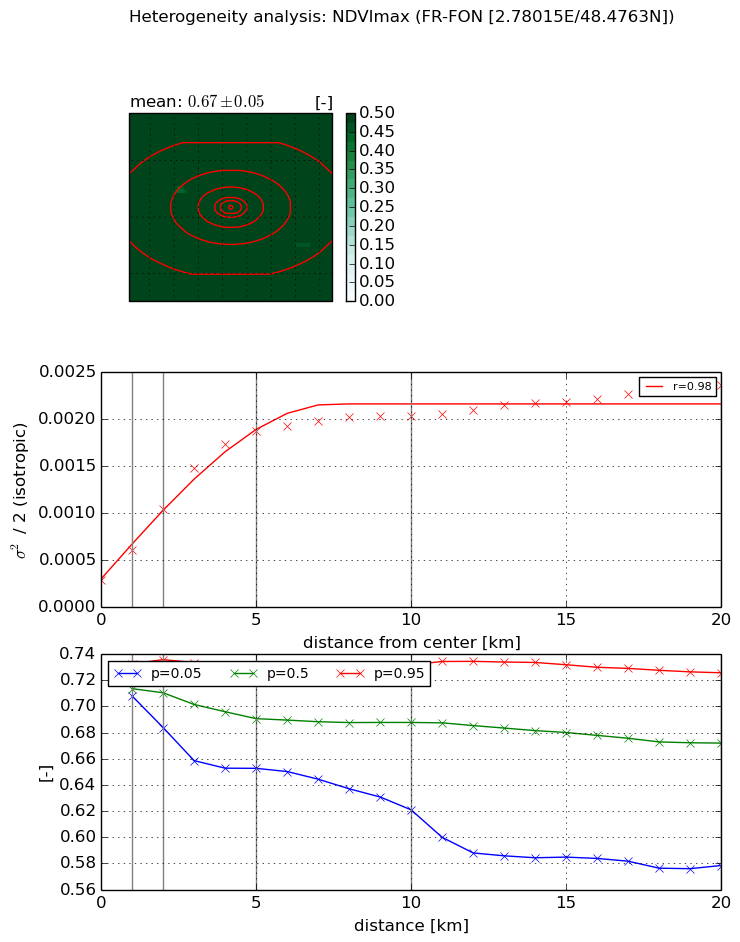
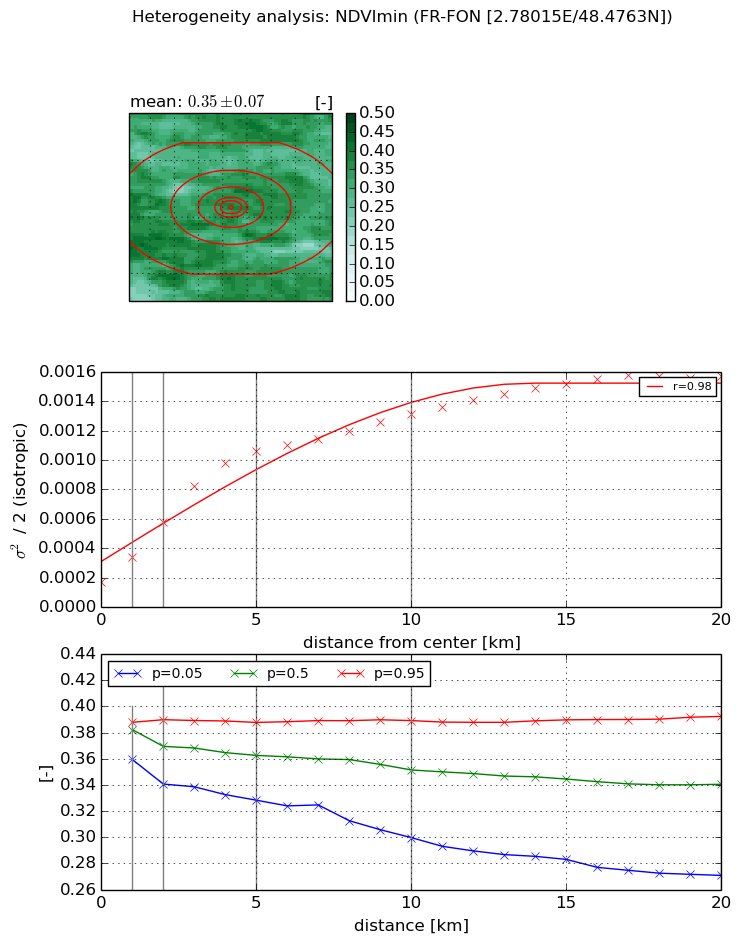
Heterogeneity analysis

The heterogeneity analysis provides information about the spatial and temporal heterogeneity of the site.

Topography


Roman et al. (2009) index


St

7.08183458881

Rcv

-0.118524412493

Rse

0.0

Rst

-0.0547910272367

Rsv

0.250303604513


Height range @ 1km [m]

59

Height range @ 2km [m]

59

Height range @ 5km [m]

58

Height range @ 10km [m]

-999

Height range @ 20km [m]

-999


Variance slope @ 1 km

118

Variance slope @ 2 km

99

Variance slope @ 5 km

55

Variance slope @ 10 km

-999

Variance slope @ 20 km

-999


NDVI (max. NDVI composite)


Roman et al. (2009) index


St

7.88523067986

Rcv

0.0773715572999

Rse

0.0

Rst

0.104360331235

Rsv

-0.198726226364


NDVI range @ 1km [-]

0.02

NDVI range @ 2km [-]

0.05

NDVI range @ 5km [-]

0.08

NDVI range @ 10km [-]

0.11

NDVI range @ 20km [-]

0.15


Variance slope @ 1 km

0.000316327812078

Variance slope @ 2 km

0.000377649471582

Variance slope @ 5 km

0.000335621226996

Variance slope @ 10 km

0.000168815277622

Variance slope @ 20 km

7.60601957155e-05


NDVI (min. NDVI composite)I


Roman et al. (2009) index


St

3.79966848404

Rcv

0.113762121479

Rse

0.0

Rst

-0.0797741585087

Rsv

0.596006284738


NDVI range @ 1km [-]

0.03

NDVI range @ 2km [-]

0.05

NDVI range @ 5km [-]

0.06

NDVI range @ 10km [-]

0.09

NDVI range @ 20km [-]

0.12


NDVI slope @ 1 km

0.000168472192279

NDVI slope @ 2 km

0.000203880403155

NDVI slope @ 5 km

0.000189211251042

NDVI slope @ 10 km

0.000109164961179

NDVI slope @ 20 km

6.10122503291e-05


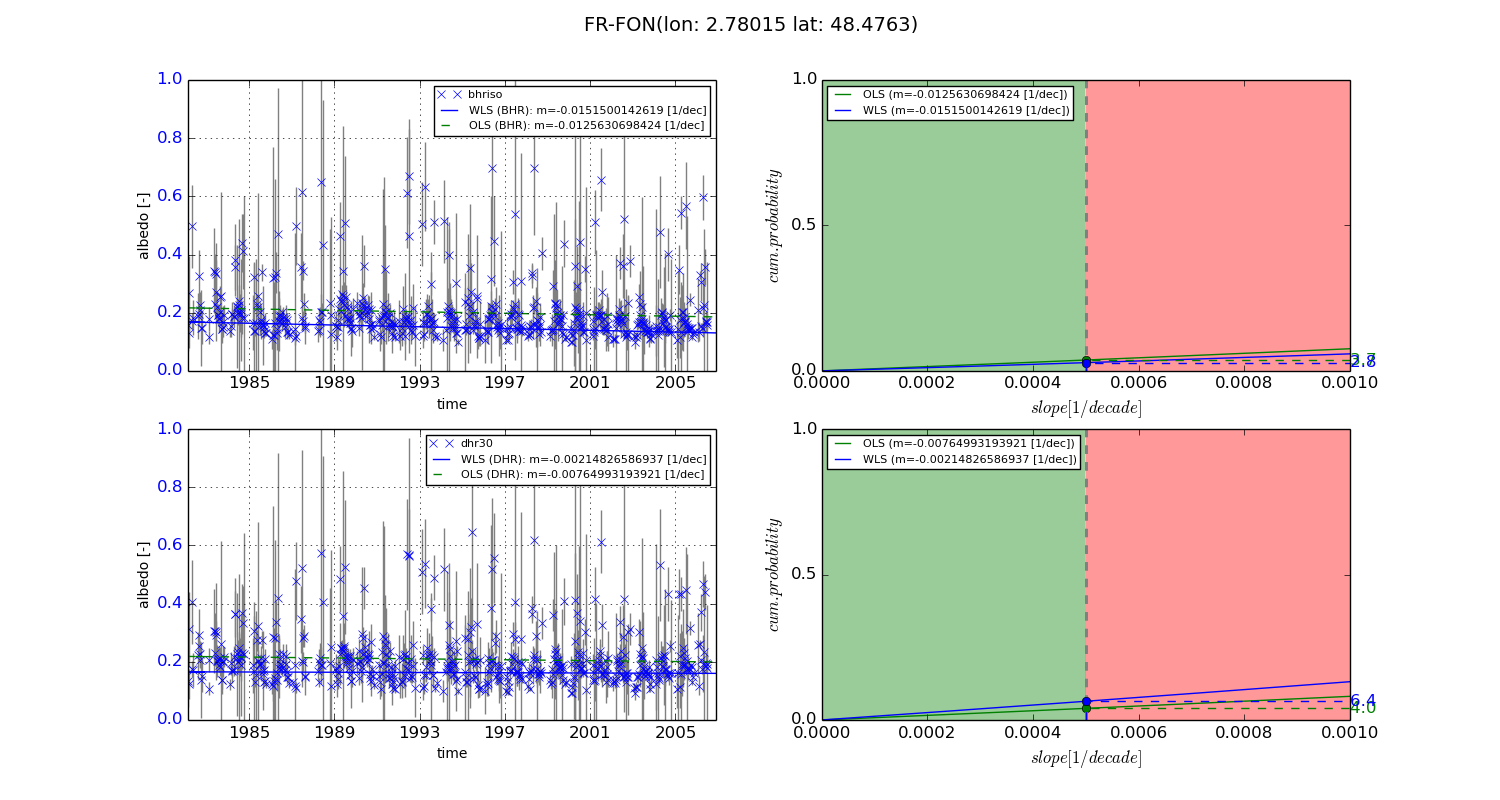
Temporal stability analysis

+000 deg (BHR)


BHR statistics

Temporal stability [1/decade]:


abs

rel


Weighted least square:

-0.0151500142619


Ordinary least square:

-0.0125630698424


Probabilities that GCOS criteria is met:

Weighted least square:

2.8 %

Ordinary least square:

3.7 %


DHR statistics

Temporal stability [1/decade]:


abs

rel


Weighted least square:

-0.00214826586937


Ordinary least square:

-0.00764993193921


Probabilities that GCOS criteria is met:

Weighted least square:

6.4 %

Ordinary least square:

4.0 %


+057/+063 deg (BHR)


BHR statistics

Temporal stability [1/decade]:


abs

rel


Weighted least square:

-99999.0


Ordinary least square:

-99999.0


Probabilities that GCOS criteria is met:

Weighted least square:

-99999.0 %

Ordinary least square:

-99999.0 %


DHR statistics

Temporal stability [1/decade]:


abs

rel


Weighted least square:

-99999.0


Ordinary least square:

-99999.0


Probabilities that GCOS criteria is met:

Weighted least square:

-99999.0 %

Ordinary least square:

-99999.0 %


Temporal anomaly analyis

The variance of the temporal anomalies provides an additional measure about the stability of the signal AFTER removal of the mean seasonal cylce.
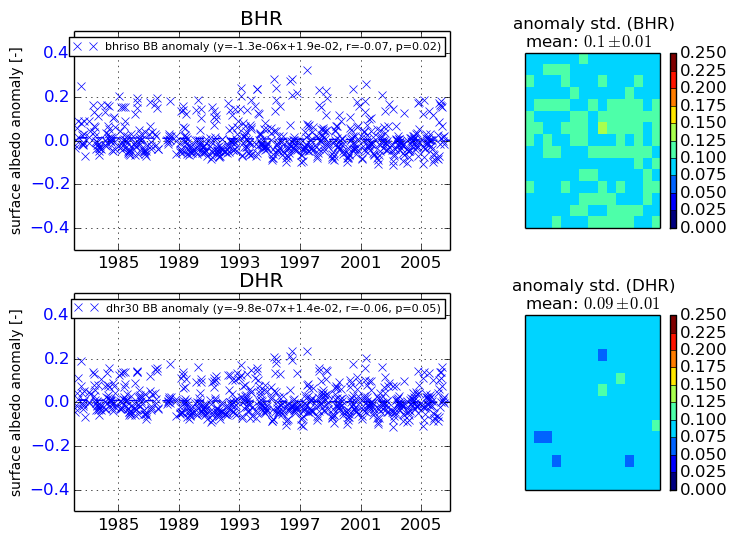
+000 deg


+057/+063 deg