FR-GRI


Location

lon / lat [deg]: 1.9524 / 48.844

Source network: FLUXNET


Geostationary surface albedo (GSA) data


“+000”


“+057/+063”


Landcover information (based on ESA CCI landcover data)


Landcover fractions @ 2km distance


Landcover fractions @ 20 km distance


Legend


Distance to open water bodies [km]:

6.62

Distance to urban areas [km]:

0.72


Radius: 1 km

Number of landcover classes:

2

Dominant landcover type:

10: cropland, rainfed

Fraction of dominant landcover type [%]:

92.0


Radius: 2 km

Number of landcover classes:

4

Dominant landcover type:

10: cropland, rainfed

Fraction of dominant landcover type [%]:

78.0


Radius: 5 km

Number of landcover classes:

3

Dominant landcover type:

10: cropland, rainfed

Fraction of dominant landcover type [%]:

54.0


Radius: 10 km

Number of landcover classes:

3

Dominant landcover type:

10: cropland, rainfed

Fraction of dominant landcover type [%]:

47.0


Radius: 20 km

Number of landcover classes:

4

Dominant landcover type:

190: urban areas

Fraction of dominant landcover type [%]:

41.0


Disturbances


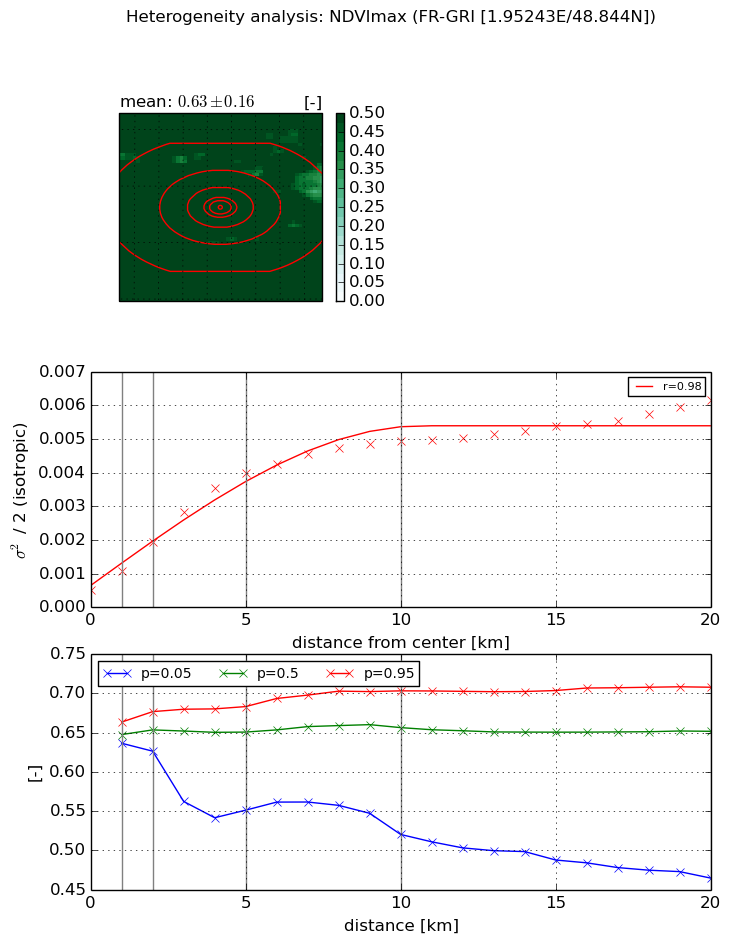
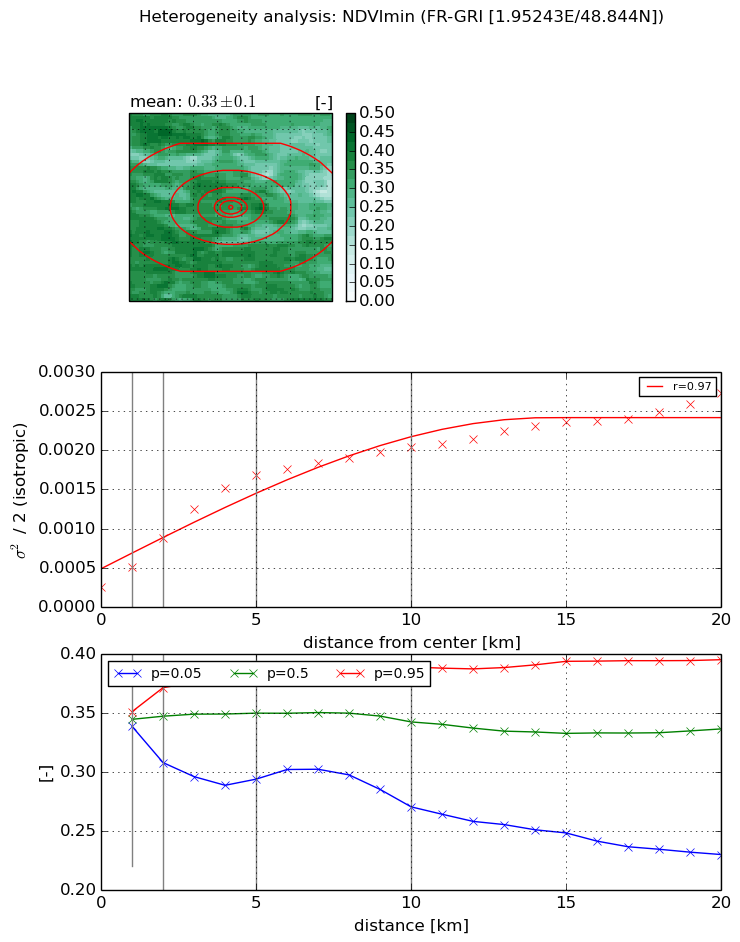
Heterogeneity analysis

The heterogeneity analysis provides information about the spatial and temporal heterogeneity of the site.

Topography


Roman et al. (2009) index


St

0.903292114407

Rcv

0.634605753663

Rse

0.0

Rst

-0.20310326037

Rsv

2.48347574132


Height range @ 1km [m]

56

Height range @ 2km [m]

53

Height range @ 5km [m]

97

Height range @ 10km [m]

-999

Height range @ 20km [m]

-999


Variance slope @ 1 km

322

Variance slope @ 2 km

261

Variance slope @ 5 km

196

Variance slope @ 10 km

-999

Variance slope @ 20 km

-999


NDVI (max. NDVI composite)


Roman et al. (2009) index


St

3.38413002677

Rcv

0.138402237936

Rse

0.0

Rst

0.312359402306

Rsv

-0.435729119944


NDVI range @ 1km [-]

0.03

NDVI range @ 2km [-]

0.05

NDVI range @ 5km [-]

0.13

NDVI range @ 10km [-]

0.18

NDVI range @ 20km [-]

0.24


Variance slope @ 1 km

0.000592484221742

Variance slope @ 2 km

0.000720414509257

Variance slope @ 5 km

0.000734166421881

Variance slope @ 10 km

0.000453114631563

Variance slope @ 20 km

0.000226551863838


NDVI (min. NDVI composite)I


Roman et al. (2009) index


St

6.77754849006

Rcv

0.18041449181

Rse

0.0

Rst

0.0583294780717

Rsv

-0.203893955085


NDVI range @ 1km [-]

0.01

NDVI range @ 2km [-]

0.06

NDVI range @ 5km [-]

0.09

NDVI range @ 10km [-]

0.12

NDVI range @ 20km [-]

0.17


NDVI slope @ 1 km

0.00026387787712

NDVI slope @ 2 km

0.000314370785473

NDVI slope @ 5 km

0.000300944098081

NDVI slope @ 10 km

0.000175207891823

NDVI slope @ 20 km

9.9602811064e-05


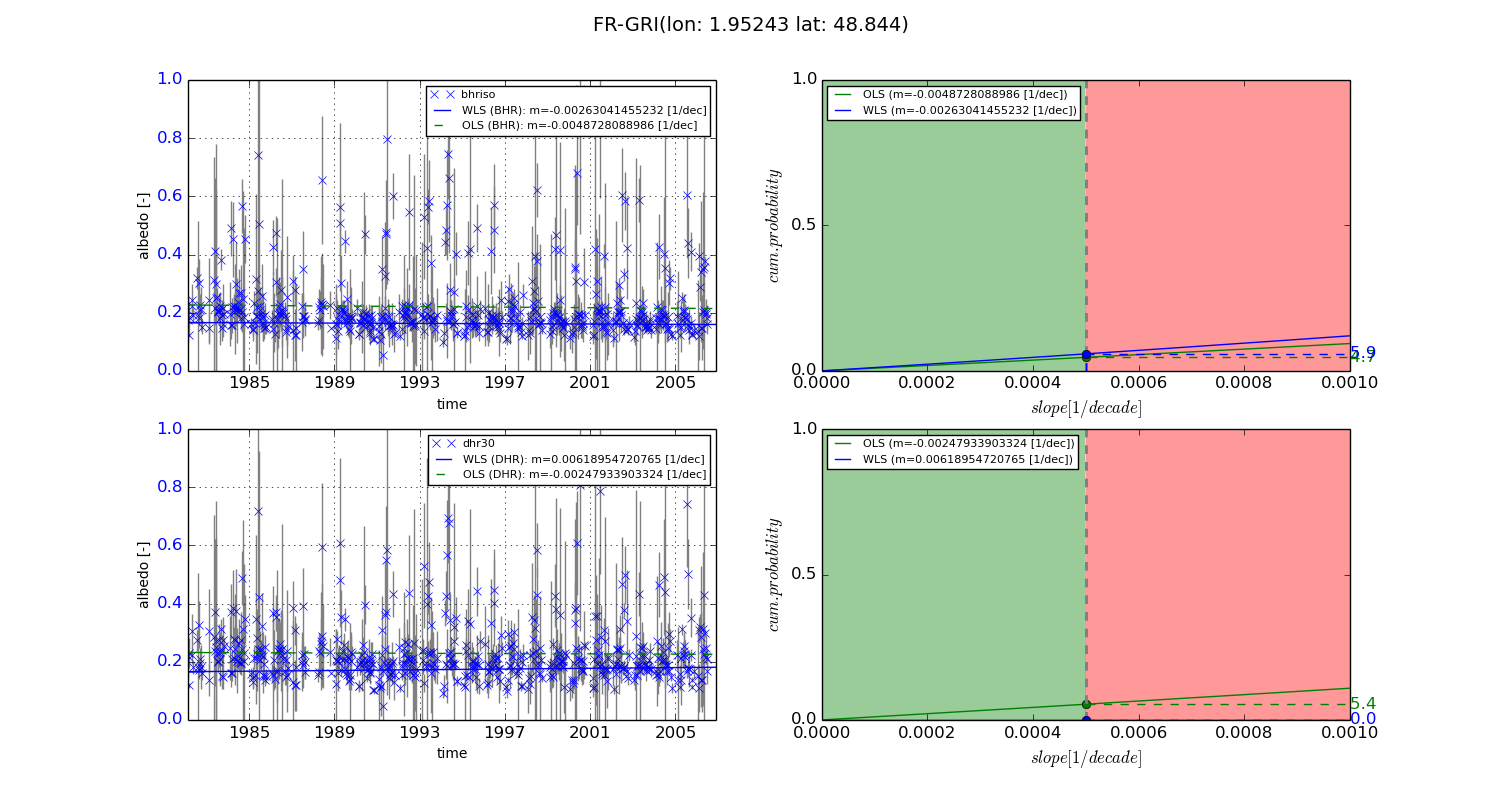
Temporal stability analysis

+000 deg (BHR)


BHR statistics

Temporal stability [1/decade]:


abs

rel


Weighted least square:

-0.00263041455232


Ordinary least square:

-0.0048728088986


Probabilities that GCOS criteria is met:

Weighted least square:

5.9 %

Ordinary least square:

4.7 %


DHR statistics

Temporal stability [1/decade]:


abs

rel


Weighted least square:

0.00618954720765


Ordinary least square:

-0.00247933903324


Probabilities that GCOS criteria is met:

Weighted least square:

0.0 %

Ordinary least square:

5.4 %


+057/+063 deg (BHR)


BHR statistics

Temporal stability [1/decade]:


abs

rel


Weighted least square:

-99999.0


Ordinary least square:

-99999.0


Probabilities that GCOS criteria is met:

Weighted least square:

-99999.0 %

Ordinary least square:

-99999.0 %


DHR statistics

Temporal stability [1/decade]:


abs

rel


Weighted least square:

-99999.0


Ordinary least square:

-99999.0


Probabilities that GCOS criteria is met:

Weighted least square:

-99999.0 %

Ordinary least square:

-99999.0 %


Temporal anomaly analyis

The variance of the temporal anomalies provides an additional measure about the stability of the signal AFTER removal of the mean seasonal cylce.
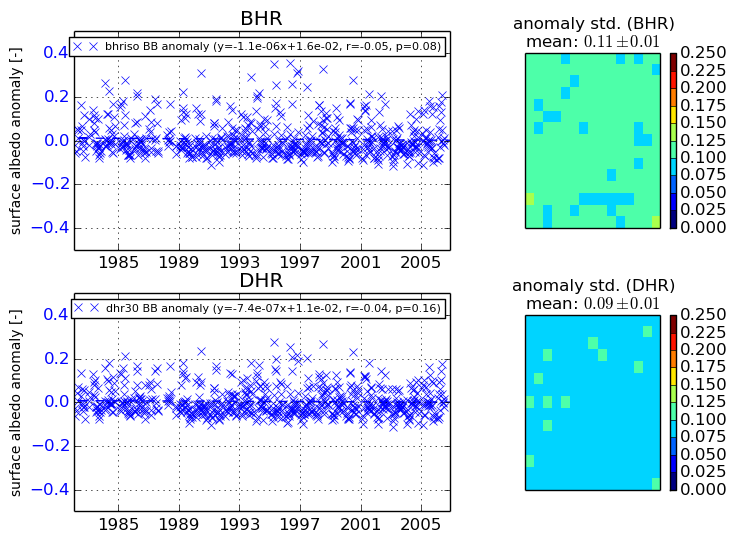
+000 deg


+057/+063 deg