FR-LAM


Location

lon / lat [deg]: 1.2372 / 43.4933

Source network: FLUXNET


Geostationary surface albedo (GSA) data


“+000”


“+057/+063”


Landcover information (based on ESA CCI landcover data)


Landcover fractions @ 2km distance


Landcover fractions @ 20 km distance


Legend


Distance to open water bodies [km]:

4.65

Distance to urban areas [km]:

1.83


Radius: 1 km

Number of landcover classes:

1

Dominant landcover type:

10: cropland, rainfed

Fraction of dominant landcover type [%]:

100.0


Radius: 2 km

Number of landcover classes:

2

Dominant landcover type:

10: cropland, rainfed

Fraction of dominant landcover type [%]:

98.0


Radius: 5 km

Number of landcover classes:

2

Dominant landcover type:

10: cropland, rainfed

Fraction of dominant landcover type [%]:

89.0


Radius: 10 km

Number of landcover classes:

3

Dominant landcover type:

10: cropland, rainfed

Fraction of dominant landcover type [%]:

78.0


Radius: 20 km

Number of landcover classes:

5

Dominant landcover type:

10: cropland, rainfed

Fraction of dominant landcover type [%]:

75.0


Disturbances


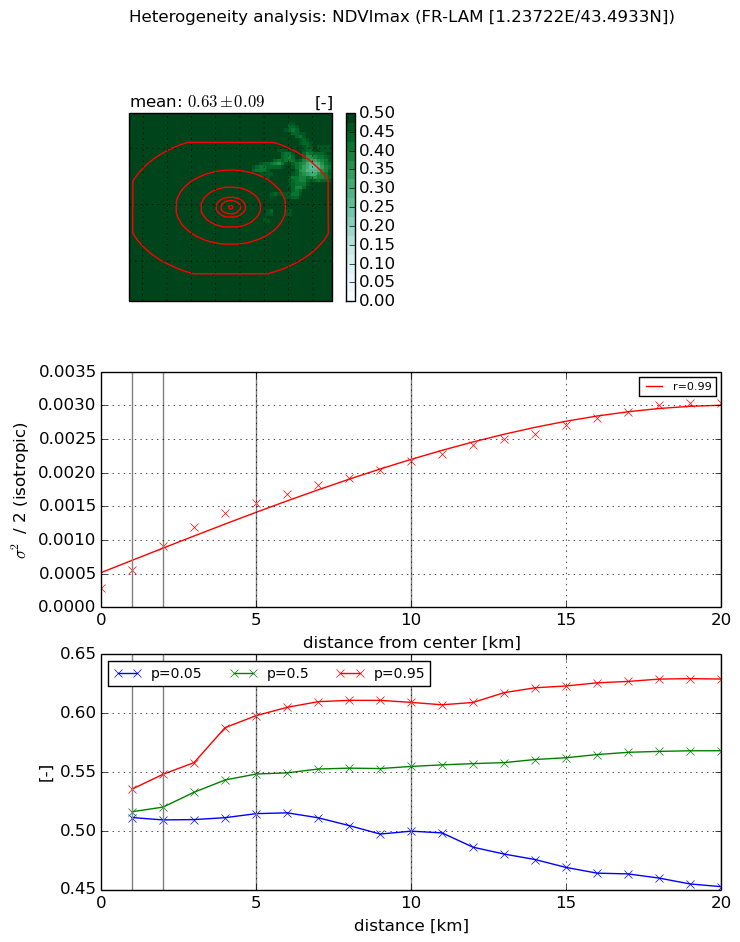
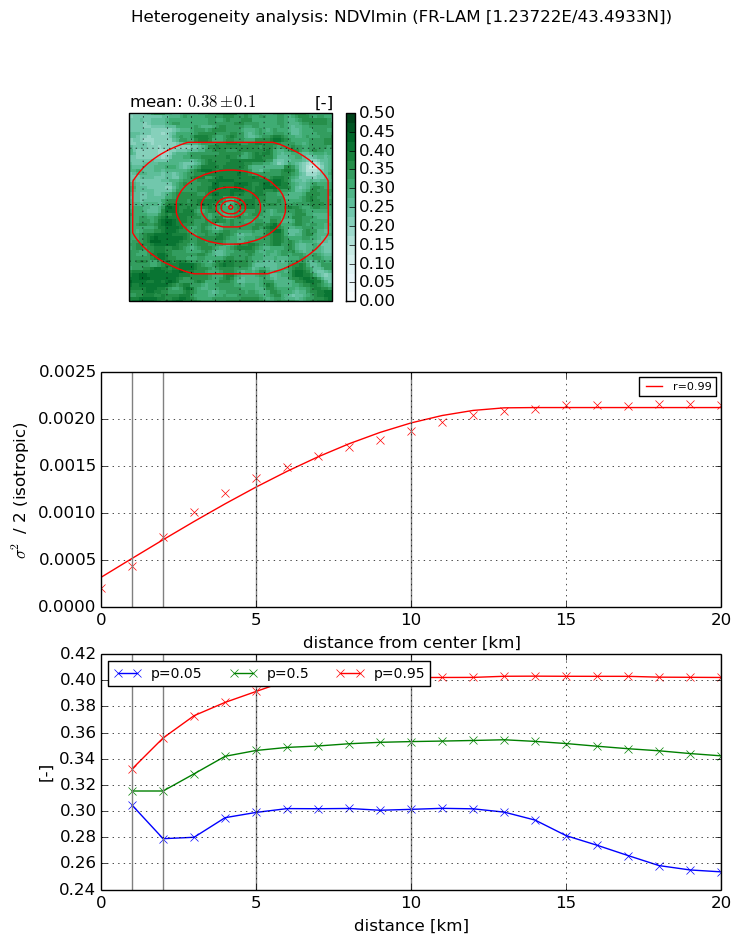
Heterogeneity analysis

The heterogeneity analysis provides information about the spatial and temporal heterogeneity of the site.

Topography


Roman et al. (2009) index


St

0.0277106807234

Rcv

0.474183336214

Rse

0.0

Rst

1.14116237478e-05

Rsv

107.787310263


Height range @ 1km [m]

5

Height range @ 2km [m]

12

Height range @ 5km [m]

45

Height range @ 10km [m]

-999

Height range @ 20km [m]

-999


Variance slope @ 1 km

38

Variance slope @ 2 km

36

Variance slope @ 5 km

48

Variance slope @ 10 km

-999

Variance slope @ 20 km

-999


NDVI (max. NDVI composite)


Roman et al. (2009) index


St

1.84161737899

Rcv

0.475174158001

Rse

0.0

Rst

-0.325877076303

Rsv

0.827951637964


NDVI range @ 1km [-]

0.02

NDVI range @ 2km [-]

0.04

NDVI range @ 5km [-]

0.08

NDVI range @ 10km [-]

0.11

NDVI range @ 20km [-]

0.18


Variance slope @ 1 km

0.000277622535164

Variance slope @ 2 km

0.000316450857299

Variance slope @ 5 km

0.000262508063689

Variance slope @ 10 km

0.00018142549013

Variance slope @ 20 km

0.000129507400278


NDVI (min. NDVI composite)I


Roman et al. (2009) index


St

63.2579671669

Rcv

0.0390680928502

Rse

0.0

Rst

-0.00302189383423

Rsv

-0.00533486957252


NDVI range @ 1km [-]

0.03

NDVI range @ 2km [-]

0.08

NDVI range @ 5km [-]

0.09

NDVI range @ 10km [-]

0.1

NDVI range @ 20km [-]

0.15


NDVI slope @ 1 km

0.000233051416132

NDVI slope @ 2 km

0.000273394515598

NDVI slope @ 5 km

0.000240556370603

NDVI slope @ 10 km

0.000164093583062

NDVI slope @ 20 km

8.87616499016e-05


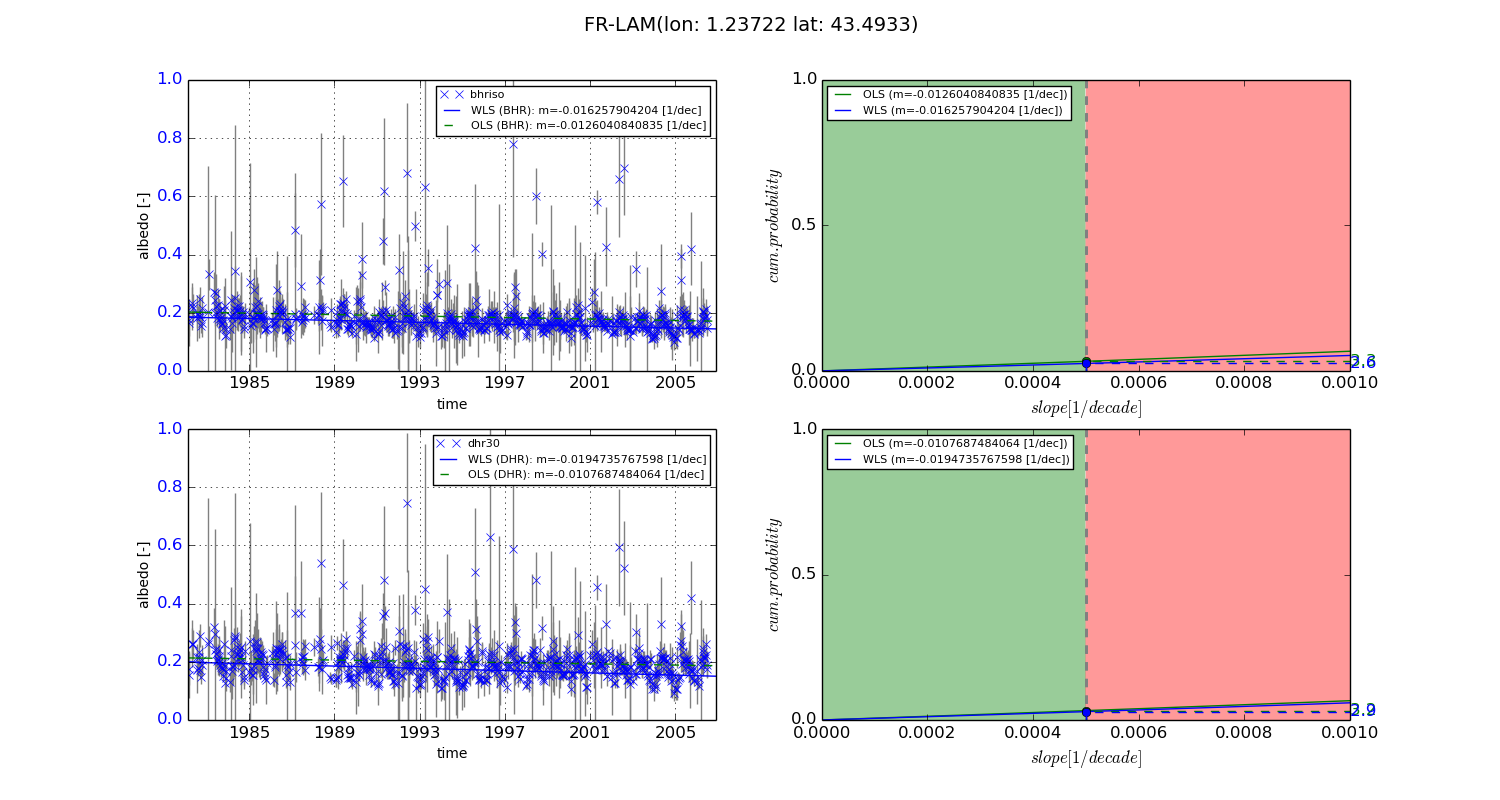
Temporal stability analysis

+000 deg (BHR)


BHR statistics

Temporal stability [1/decade]:


abs

rel


Weighted least square:

-0.016257904204


Ordinary least square:

-0.0126040840835


Probabilities that GCOS criteria is met:

Weighted least square:

2.6 %

Ordinary least square:

3.3 %


DHR statistics

Temporal stability [1/decade]:


abs

rel


Weighted least square:

-0.0194735767598


Ordinary least square:

-0.0107687484064


Probabilities that GCOS criteria is met:

Weighted least square:

2.9 %

Ordinary least square:

3.2 %


+057/+063 deg (BHR)


BHR statistics

Temporal stability [1/decade]:


abs

rel


Weighted least square:

-99999.0


Ordinary least square:

-99999.0


Probabilities that GCOS criteria is met:

Weighted least square:

-99999.0 %

Ordinary least square:

-99999.0 %


DHR statistics

Temporal stability [1/decade]:


abs

rel


Weighted least square:

-99999.0


Ordinary least square:

-99999.0


Probabilities that GCOS criteria is met:

Weighted least square:

-99999.0 %

Ordinary least square:

-99999.0 %


Temporal anomaly analyis

The variance of the temporal anomalies provides an additional measure about the stability of the signal AFTER removal of the mean seasonal cylce.
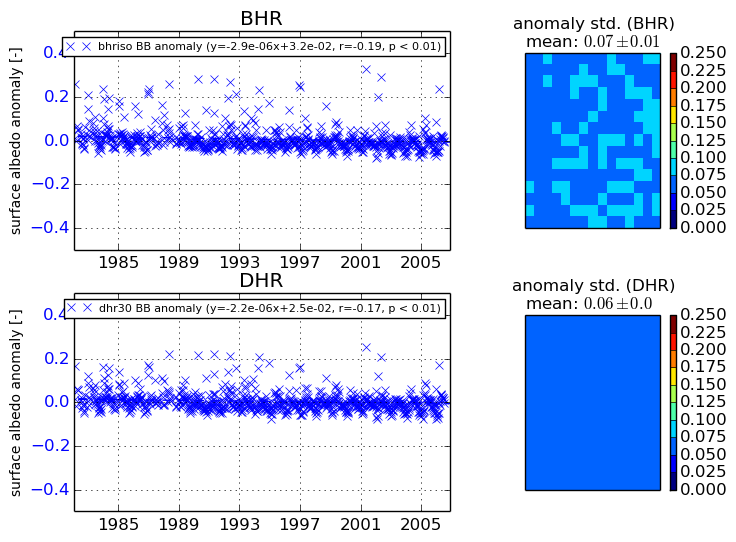
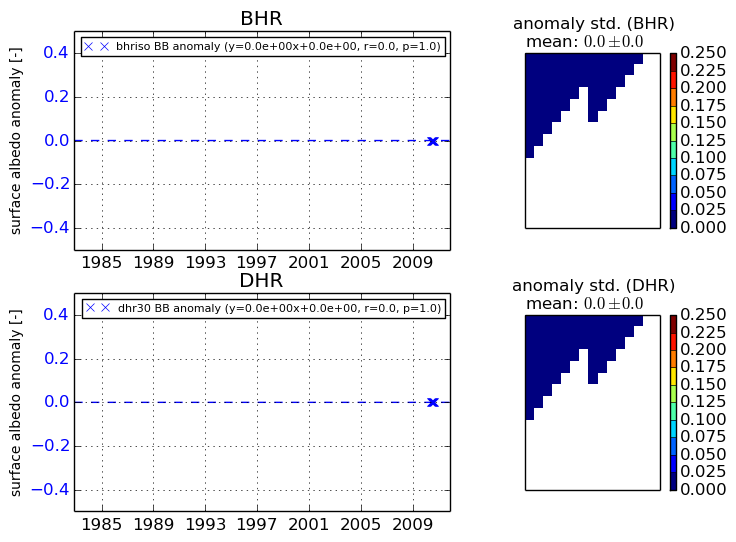
+000 deg


+057/+063 deg