FR-LQ2


Location

lon / lat [deg]: 2.737 / 45.6392

Source network: FLUXNET


Geostationary surface albedo (GSA) data


“+000”


“+057/+063”


Landcover information (based on ESA CCI landcover data)


Landcover fractions @ 2km distance


Landcover fractions @ 20 km distance


Legend


Distance to open water bodies [km]:

7.06

Distance to urban areas [km]:

4.53


Radius: 1 km

Number of landcover classes:

4

Dominant landcover type:

130: grassland

Fraction of dominant landcover type [%]:

74.0


Radius: 2 km

Number of landcover classes:

6

Dominant landcover type:

130: grassland

Fraction of dominant landcover type [%]:

80.0


Radius: 5 km

Number of landcover classes:

6

Dominant landcover type:

130: grassland

Fraction of dominant landcover type [%]:

78.0


Radius: 10 km

Number of landcover classes:

8

Dominant landcover type:

130: grassland

Fraction of dominant landcover type [%]:

51.0


Radius: 20 km

Number of landcover classes:

9

Dominant landcover type:

130: grassland

Fraction of dominant landcover type [%]:

48.0


Disturbances


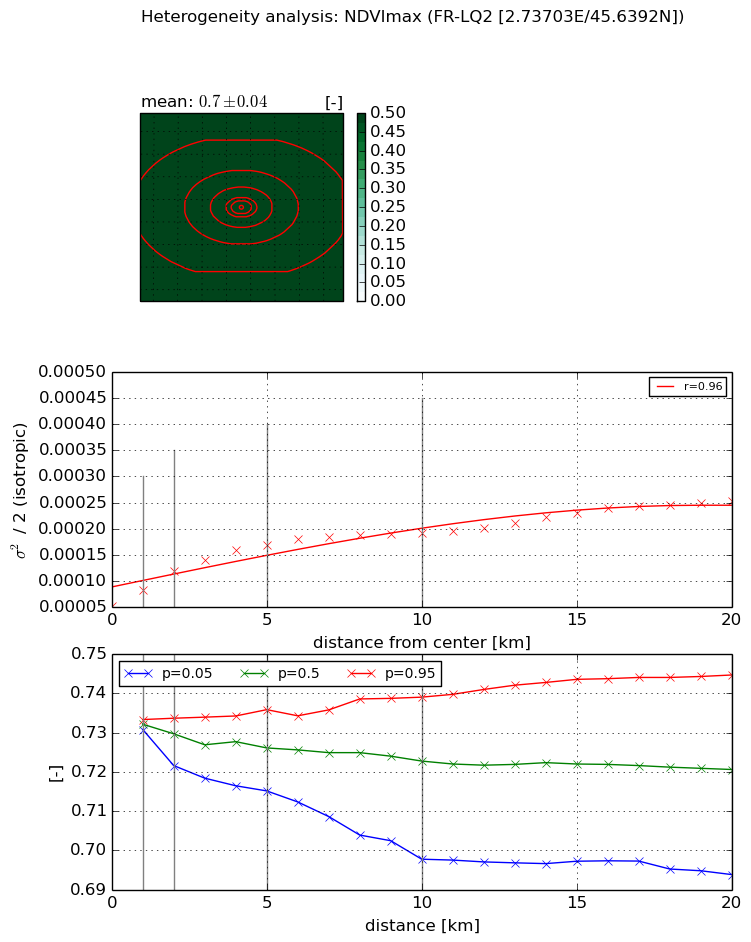
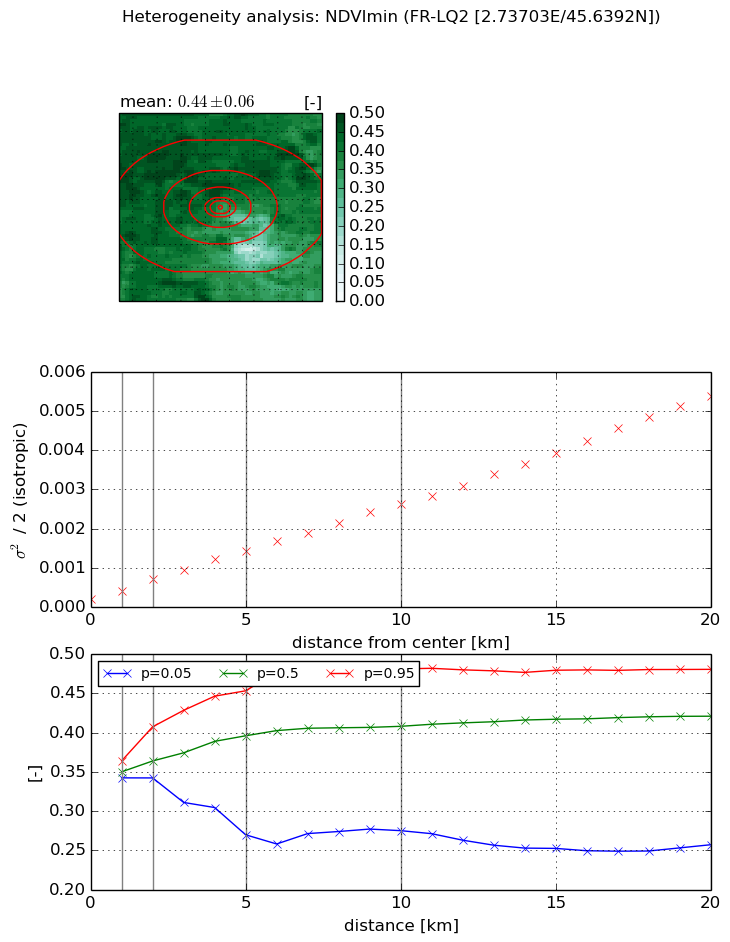
Heterogeneity analysis

The heterogeneity analysis provides information about the spatial and temporal heterogeneity of the site.

Topography


Roman et al. (2009) index


St

2.54638238979

Rcv

0.387092744779

Rse

0.0

Rst

-1.83640864542e-07

Rsv

-0.791049055292


Height range @ 1km [m]

158

Height range @ 2km [m]

247

Height range @ 5km [m]

435

Height range @ 10km [m]

-999

Height range @ 20km [m]

-999


Variance slope @ 1 km

2345

Variance slope @ 2 km

3179

Variance slope @ 5 km

4345

Variance slope @ 10 km

-999

Variance slope @ 20 km

-999


NDVI (max. NDVI composite)


Roman et al. (2009) index


St

nan

Rcv

nan

Rse

nan

Rst

nan

Rsv

nan


NDVI range @ 1km [-]

0.0

NDVI range @ 2km [-]

0.01

NDVI range @ 5km [-]

0.02

NDVI range @ 10km [-]

0.04

NDVI range @ 20km [-]

0.05


Variance slope @ 1 km

3.04510505682e-05

Variance slope @ 2 km

3.34931163813e-05

Variance slope @ 5 km

2.37967162522e-05

Variance slope @ 10 km

1.30746877975e-05

Variance slope @ 20 km

8.19255042744e-06


NDVI (min. NDVI composite)I


Roman et al. (2009) index


St

1.27384734082e-07

Rcv

0.379539890416

Rse

0.0

Rst

0.104093868683

Rsv

23550702.2095


NDVI range @ 1km [-]

0.02

NDVI range @ 2km [-]

0.07

NDVI range @ 5km [-]

0.18

NDVI range @ 10km [-]

0.21

NDVI range @ 20km [-]

0.22


NDVI slope @ 1 km

0.000197600253434

NDVI slope @ 2 km

0.000256297041962

NDVI slope @ 5 km

0.0002542486254

NDVI slope @ 10 km

0.000244548834115

NDVI slope @ 20 km

0.000257005201265


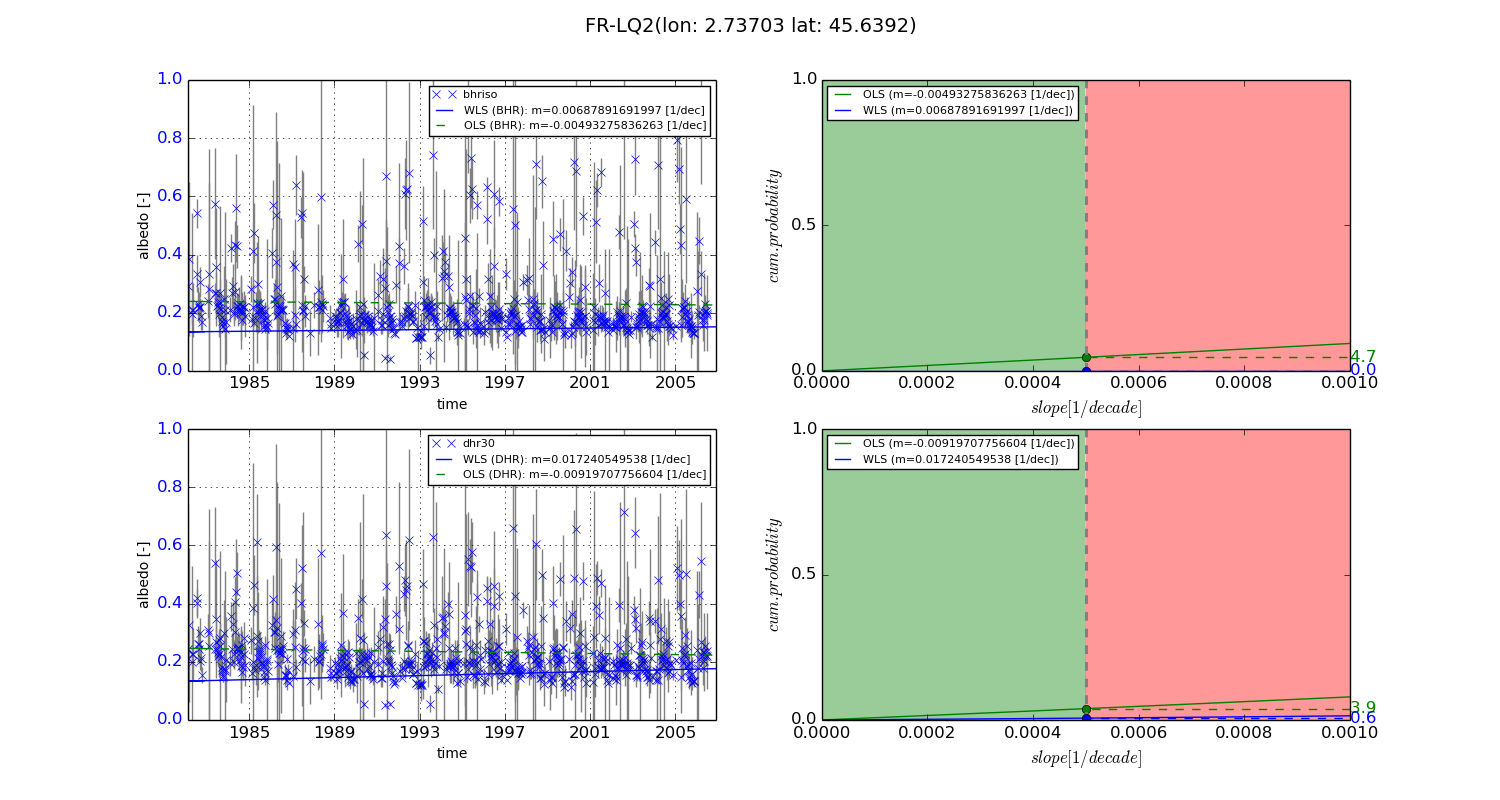
Temporal stability analysis

+000 deg (BHR)


BHR statistics

Temporal stability [1/decade]:


abs

rel


Weighted least square:

0.00687891691997


Ordinary least square:

-0.00493275836263


Probabilities that GCOS criteria is met:

Weighted least square:

0.0 %

Ordinary least square:

4.7 %


DHR statistics

Temporal stability [1/decade]:


abs

rel


Weighted least square:

0.017240549538


Ordinary least square:

-0.00919707756604


Probabilities that GCOS criteria is met:

Weighted least square:

0.6 %

Ordinary least square:

3.9 %


+057/+063 deg (BHR)


BHR statistics

Temporal stability [1/decade]:


abs

rel


Weighted least square:

-99999.0


Ordinary least square:

-99999.0


Probabilities that GCOS criteria is met:

Weighted least square:

-99999.0 %

Ordinary least square:

-99999.0 %


DHR statistics

Temporal stability [1/decade]:


abs

rel


Weighted least square:

-99999.0


Ordinary least square:

-99999.0


Probabilities that GCOS criteria is met:

Weighted least square:

-99999.0 %

Ordinary least square:

-99999.0 %


Temporal anomaly analyis

The variance of the temporal anomalies provides an additional measure about the stability of the signal AFTER removal of the mean seasonal cylce.
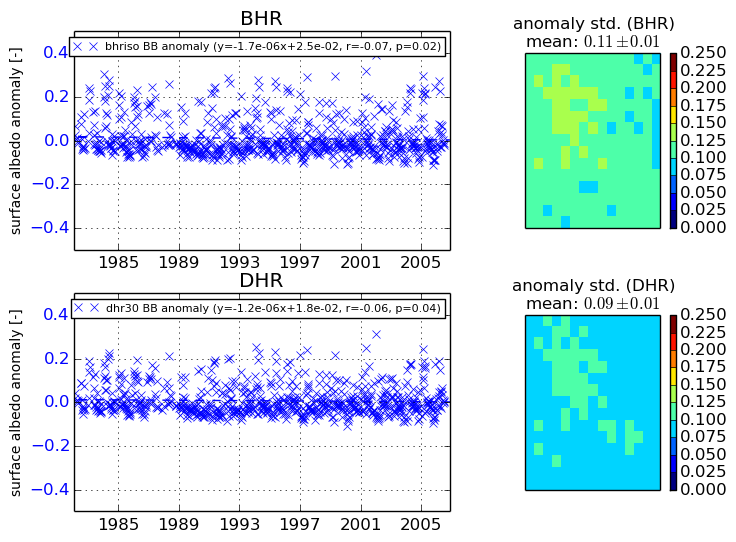
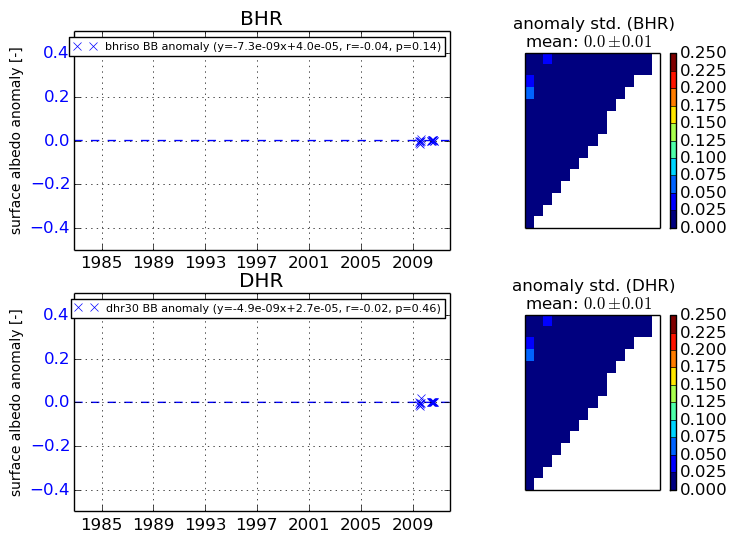
+000 deg


+057/+063 deg