FRESNO


Location

lon / lat [deg]: -119.7732 / 36.7817

Source network: AERONET


Geostationary surface albedo (GSA) data


“+000”


“+057/+063”


Landcover information (based on ESA CCI landcover data)


Landcover fractions @ 2km distance


Landcover fractions @ 20 km distance


Legend


Distance to open water bodies [km]:

2.77

Distance to urban areas [km]:

0.05


Radius: 1 km

Number of landcover classes:

1

Dominant landcover type:

190: urban areas

Fraction of dominant landcover type [%]:

100.0


Radius: 2 km

Number of landcover classes:

1

Dominant landcover type:

190: urban areas

Fraction of dominant landcover type [%]:

100.0


Radius: 5 km

Number of landcover classes:

2

Dominant landcover type:

190: urban areas

Fraction of dominant landcover type [%]:

98.0


Radius: 10 km

Number of landcover classes:

3

Dominant landcover type:

190: urban areas

Fraction of dominant landcover type [%]:

91.0


Radius: 20 km

Number of landcover classes:

5

Dominant landcover type:

130: grassland

Fraction of dominant landcover type [%]:

36.0


Disturbances


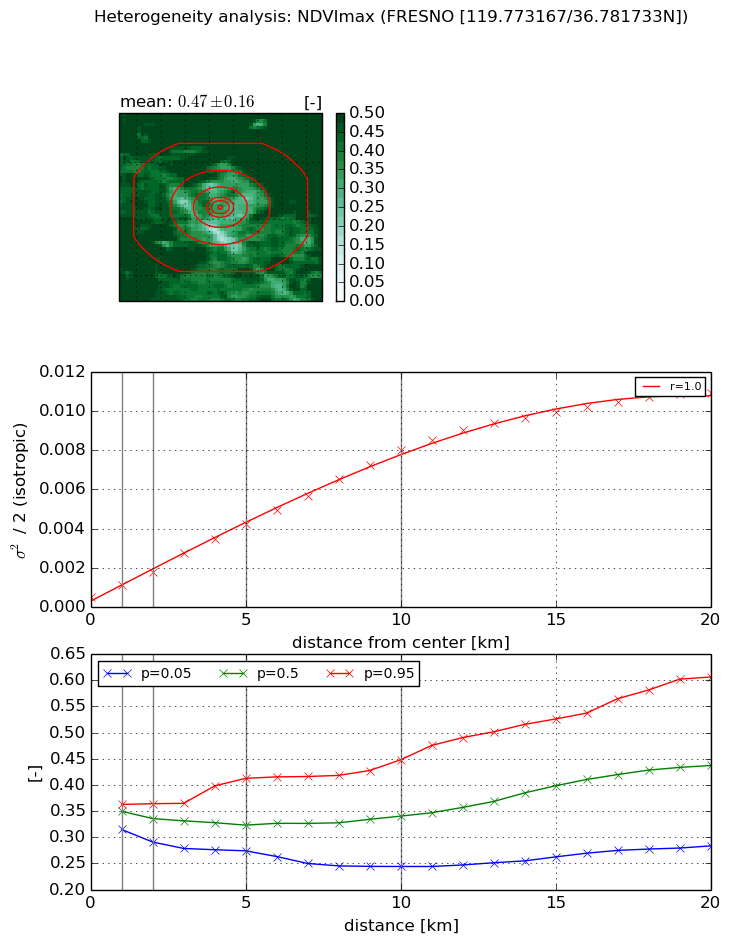
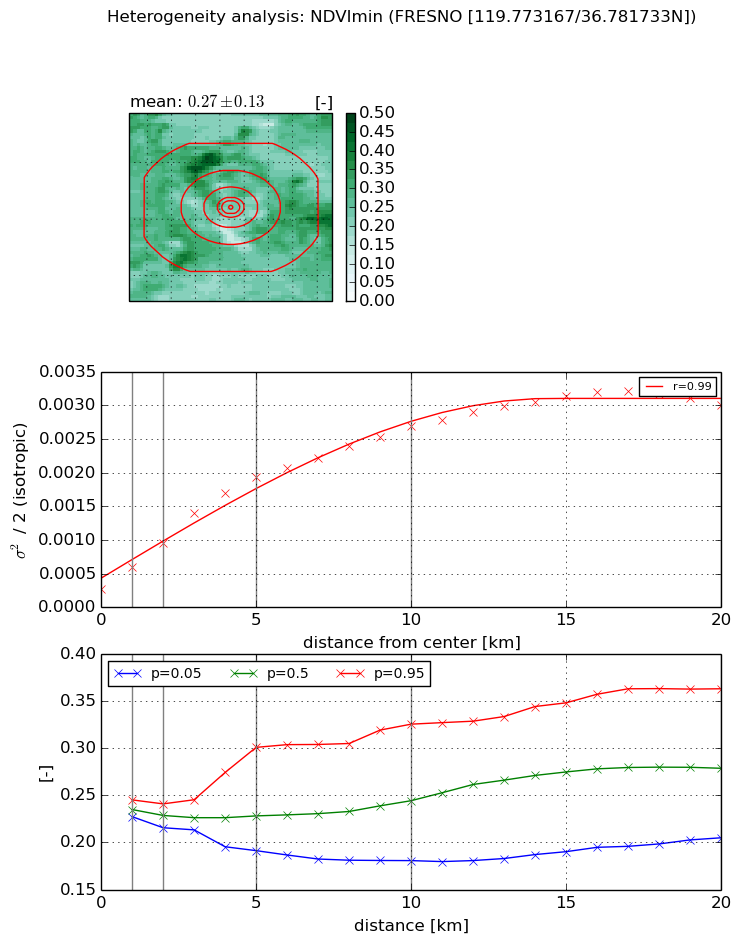
Heterogeneity analysis

The heterogeneity analysis provides information about the spatial and temporal heterogeneity of the site.

Topography


Roman et al. (2009) index


St

0.7407721947

Rcv

0.464875327537

Rse

0.0

Rst

2.77570073597e-08

Rsv

3.58495267749


Height range @ 1km [m]

6

Height range @ 2km [m]

8

Height range @ 5km [m]

14

Height range @ 10km [m]

-999

Height range @ 20km [m]

-999


Variance slope @ 1 km

2

Variance slope @ 2 km

2

Variance slope @ 5 km

3

Variance slope @ 10 km

-999

Variance slope @ 20 km

-999


NDVI (max. NDVI composite)


Roman et al. (2009) index


St

9.81920085831e-08

Rcv

0.681381250558

Rse

0.0

Rst

0.209244372057

Rsv

30552383.5986


NDVI range @ 1km [-]

0.05

NDVI range @ 2km [-]

0.07

NDVI range @ 5km [-]

0.14

NDVI range @ 10km [-]

0.2

NDVI range @ 20km [-]

0.32


Variance slope @ 1 km

0.000594156811958

Variance slope @ 2 km

0.000648896831425

Variance slope @ 5 km

0.000765905576123

Variance slope @ 10 km

0.000758330054537

Variance slope @ 20 km

0.000548128553892


NDVI (min. NDVI composite)I


Roman et al. (2009) index


St

2.25510263589e-06

Rcv

1.53907850375

Rse

0.0

Rst

0.0148906443361

Rsv

1330314.83707


NDVI range @ 1km [-]

0.02

NDVI range @ 2km [-]

0.03

NDVI range @ 5km [-]

0.11

NDVI range @ 10km [-]

0.14

NDVI range @ 20km [-]

0.16


NDVI slope @ 1 km

0.0003173688142

NDVI slope @ 2 km

0.000340721534186

NDVI slope @ 5 km

0.000345230213048

NDVI slope @ 10 km

0.000238052229984

NDVI slope @ 20 km

0.000133821057473


Temporal stability analysis

+000 deg (BHR)


BHR statistics

Temporal stability [1/decade]:


abs

rel


Weighted least square:

None


Ordinary least square:

None


Probabilities that GCOS criteria is met:

Weighted least square:

None %

Ordinary least square:

None %


DHR statistics

Temporal stability [1/decade]:


abs

rel


Weighted least square:

None


Ordinary least square:

None


Probabilities that GCOS criteria is met:

Weighted least square:

None %

Ordinary least square:

None %


+057/+063 deg (BHR)


BHR statistics

Temporal stability [1/decade]:


abs

rel


Weighted least square:

None


Ordinary least square:

None


Probabilities that GCOS criteria is met:

Weighted least square:

None %

Ordinary least square:

None %


DHR statistics

Temporal stability [1/decade]:


abs

rel


Weighted least square:

None


Ordinary least square:

None


Probabilities that GCOS criteria is met:

Weighted least square:

None %

Ordinary least square:

None %


Temporal anomaly analyis

The variance of the temporal anomalies provides an additional measure about the stability of the signal AFTER removal of the mean seasonal cylce.

+000 deg


+057/+063 deg