FZJ-JOYCE


Location

lon / lat [deg]: 6.4125 / 50.9083

Source network: AERONET


Geostationary surface albedo (GSA) data


“+000”


“+057/+063”


Landcover information (based on ESA CCI landcover data)


Landcover fractions @ 2km distance


Landcover fractions @ 20 km distance


Legend


Distance to open water bodies [km]:

7.35

Distance to urban areas [km]:

0.15


Radius: 1 km

Number of landcover classes:

3

Dominant landcover type:

190: urban areas

Fraction of dominant landcover type [%]:

59.0


Radius: 2 km

Number of landcover classes:

4

Dominant landcover type:

190: urban areas

Fraction of dominant landcover type [%]:

45.0


Radius: 5 km

Number of landcover classes:

3

Dominant landcover type:

190: urban areas

Fraction of dominant landcover type [%]:

44.0


Radius: 10 km

Number of landcover classes:

3

Dominant landcover type:

10: cropland, rainfed

Fraction of dominant landcover type [%]:

53.0


Radius: 20 km

Number of landcover classes:

5

Dominant landcover type:

10: cropland, rainfed

Fraction of dominant landcover type [%]:

54.0


Disturbances


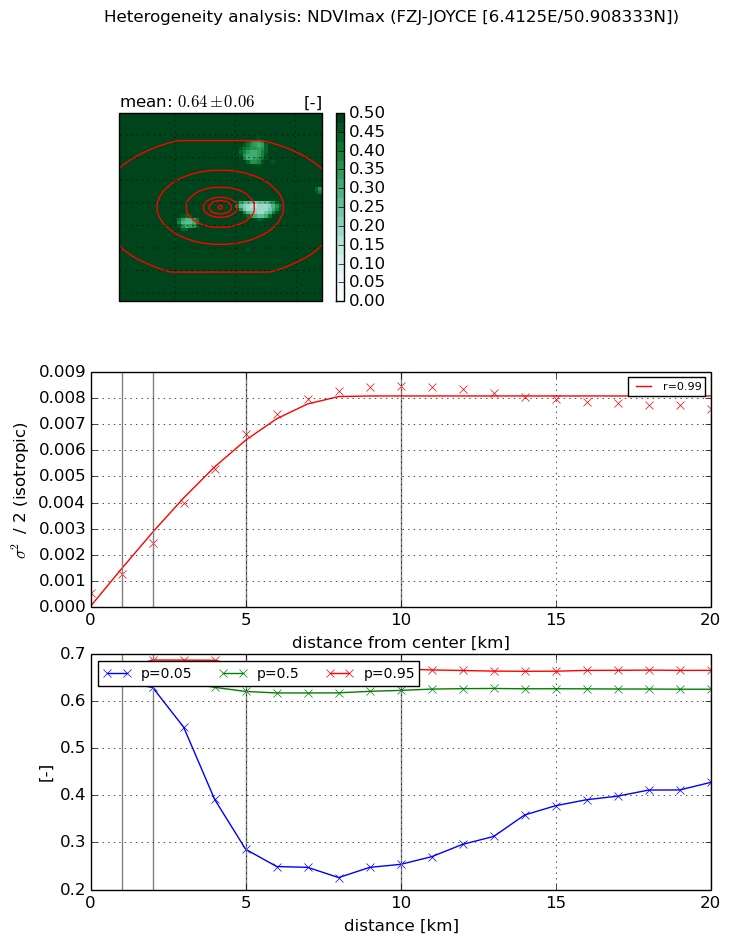
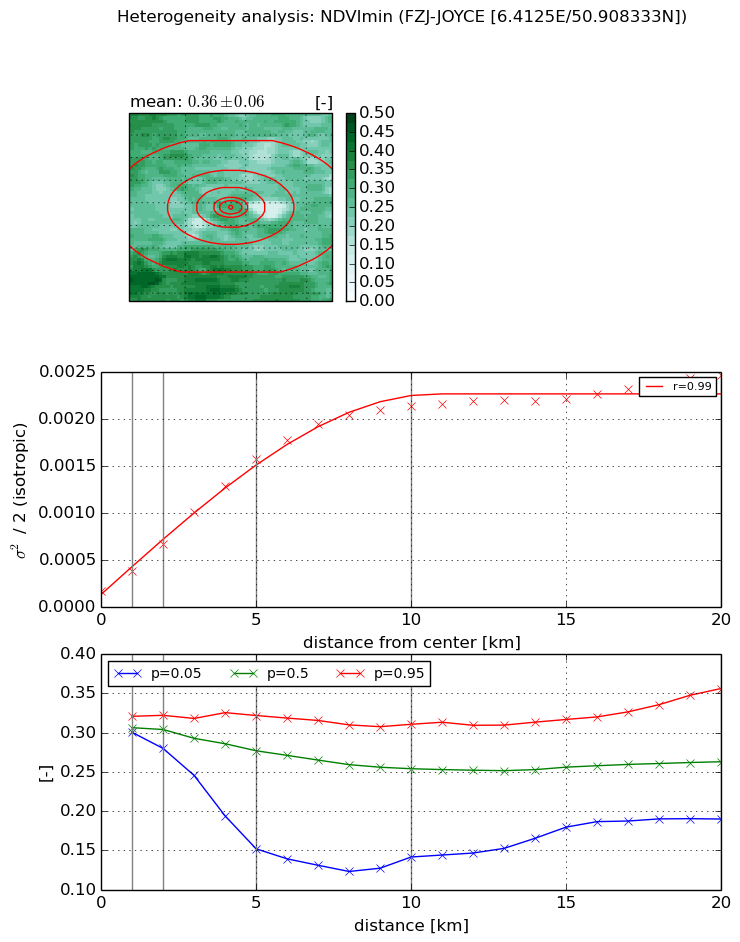
Heterogeneity analysis

The heterogeneity analysis provides information about the spatial and temporal heterogeneity of the site.

Topography


Roman et al. (2009) index


St

3.98887829294e-18

Rcv

0.181667416498

Rse

0.0

Rst

-0.0271851051483

Rsv

7.5209113432e+17


Height range @ 1km [m]

15

Height range @ 2km [m]

29

Height range @ 5km [m]

154

Height range @ 10km [m]

-999

Height range @ 20km [m]

-999


Variance slope @ 1 km

728

Variance slope @ 2 km

746

Variance slope @ 5 km

341

Variance slope @ 10 km

-999

Variance slope @ 20 km

-999


NDVI (max. NDVI composite)


Roman et al. (2009) index


St

1.22238349037

Rcv

1.31584397659

Rse

0.0

Rst

-0.13837773772

Rsv

-0.999999913876


NDVI range @ 1km [-]

0.03

NDVI range @ 2km [-]

0.06

NDVI range @ 5km [-]

0.39

NDVI range @ 10km [-]

0.42

NDVI range @ 20km [-]

0.24


Variance slope @ 1 km

0.0007387136819

Variance slope @ 2 km

0.000949890940642

Variance slope @ 5 km

0.00125544169027

Variance slope @ 10 km

0.000869873679185

Variance slope @ 20 km

0.000290116757006


NDVI (min. NDVI composite)I


Roman et al. (2009) index


St

1.39445959743

Rcv

1.06098250498

Rse

0.0

Rst

0.0903965992042

Rsv

-0.999991939865


NDVI range @ 1km [-]

0.02

NDVI range @ 2km [-]

0.04

NDVI range @ 5km [-]

0.17

NDVI range @ 10km [-]

0.17

NDVI range @ 20km [-]

0.17


NDVI slope @ 1 km

0.000208940607887

NDVI slope @ 2 km

0.00024947567753

NDVI slope @ 5 km

0.000287532392038

NDVI slope @ 10 km

0.000210811850219

NDVI slope @ 20 km

9.86029746997e-05


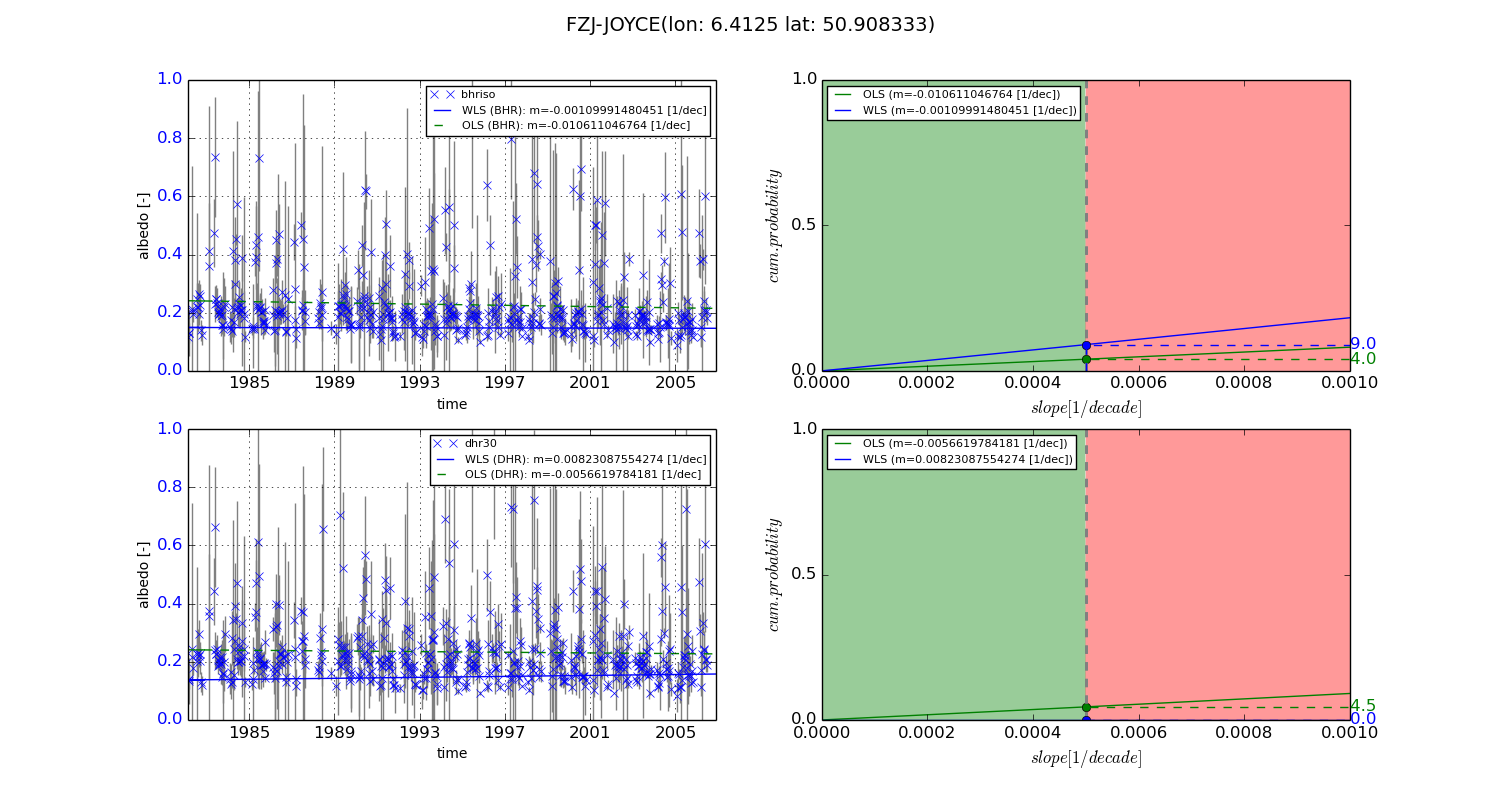
Temporal stability analysis

+000 deg (BHR)


BHR statistics

Temporal stability [1/decade]:


abs

rel


Weighted least square:

-0.00109991480451


Ordinary least square:

-0.010611046764


Probabilities that GCOS criteria is met:

Weighted least square:

9.0 %

Ordinary least square:

4.0 %


DHR statistics

Temporal stability [1/decade]:


abs

rel


Weighted least square:

0.00823087554274


Ordinary least square:

-0.0056619784181


Probabilities that GCOS criteria is met:

Weighted least square:

0.0 %

Ordinary least square:

4.5 %


+057/+063 deg (BHR)


BHR statistics

Temporal stability [1/decade]:


abs

rel


Weighted least square:

-99999.0


Ordinary least square:

-99999.0


Probabilities that GCOS criteria is met:

Weighted least square:

-99999.0 %

Ordinary least square:

-99999.0 %


DHR statistics

Temporal stability [1/decade]:


abs

rel


Weighted least square:

-99999.0


Ordinary least square:

-99999.0


Probabilities that GCOS criteria is met:

Weighted least square:

-99999.0 %

Ordinary least square:

-99999.0 %


Temporal anomaly analyis

The variance of the temporal anomalies provides an additional measure about the stability of the signal AFTER removal of the mean seasonal cylce.
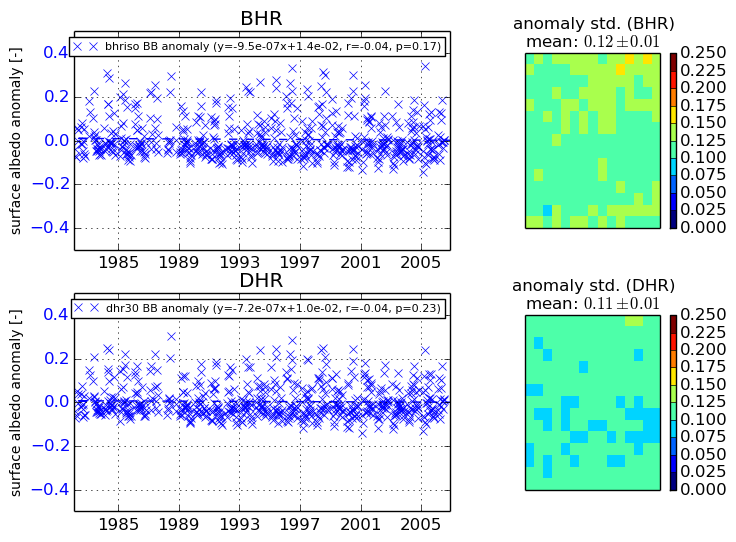
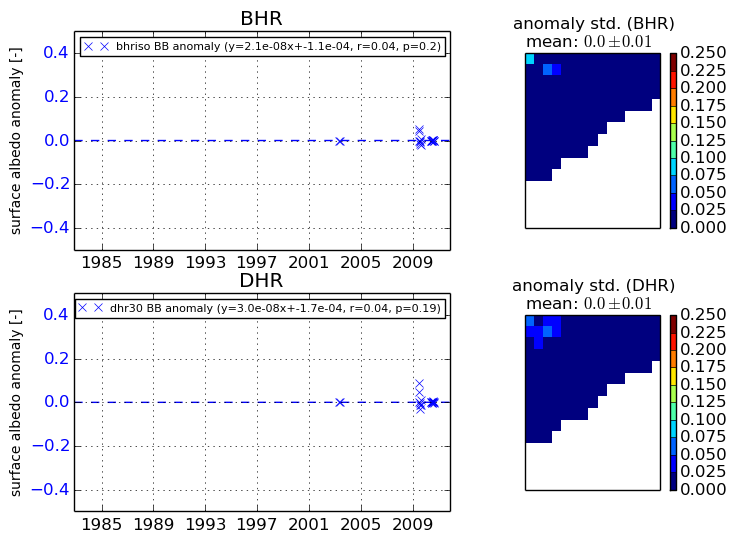
+000 deg


+057/+063 deg