GAINESVILLE_AIRPORT


Location

lon / lat [deg]: -82.261 / 29.6958

Source network: AERONET


Geostationary surface albedo (GSA) data


“+000”


“+057/+063”


Landcover information (based on ESA CCI landcover data)


Landcover fractions @ 2km distance


Landcover fractions @ 20 km distance


Legend


Distance to open water bodies [km]:

3.75

Distance to urban areas [km]:

0.64


Radius: 1 km

Number of landcover classes:

4

Dominant landcover type:

70: Tree cover, needleleaved, evergreen, closed to open (>15%)

Fraction of dominant landcover type [%]:

61.0


Radius: 2 km

Number of landcover classes:

5

Dominant landcover type:

70: Tree cover, needleleaved, evergreen, closed to open (>15%)

Fraction of dominant landcover type [%]:

53.0


Radius: 5 km

Number of landcover classes:

7

Dominant landcover type:

70: Tree cover, needleleaved, evergreen, closed to open (>15%)

Fraction of dominant landcover type [%]:

48.0


Radius: 10 km

Number of landcover classes:

6

Dominant landcover type:

70: Tree cover, needleleaved, evergreen, closed to open (>15%)

Fraction of dominant landcover type [%]:

51.0


Radius: 20 km

Number of landcover classes:

9

Dominant landcover type:

70: Tree cover, needleleaved, evergreen, closed to open (>15%)

Fraction of dominant landcover type [%]:

47.0


Disturbances


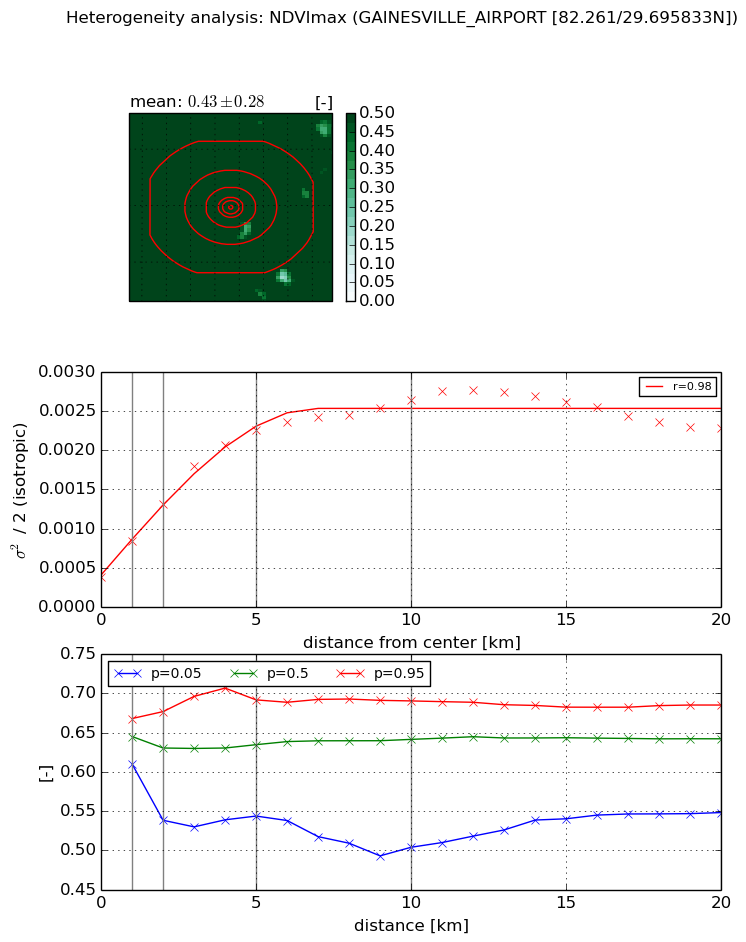
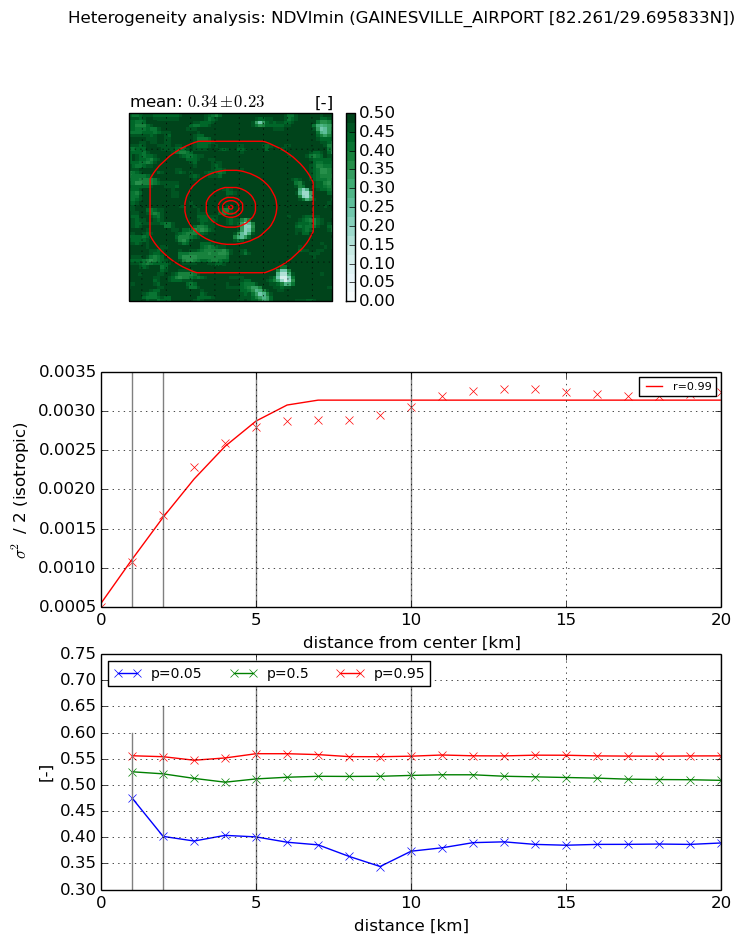
Heterogeneity analysis

The heterogeneity analysis provides information about the spatial and temporal heterogeneity of the site.

Topography


Roman et al. (2009) index


St

1.87404016555

Rcv

0.610725948522

Rse

0.0

Rst

3.27322417422e-07

Rsv

-0.990093202384


Height range @ 1km [m]

12

Height range @ 2km [m]

13

Height range @ 5km [m]

26

Height range @ 10km [m]

-999

Height range @ 20km [m]

-999


Variance slope @ 1 km

20

Variance slope @ 2 km

15

Variance slope @ 5 km

10

Variance slope @ 10 km

-999

Variance slope @ 20 km

-999


NDVI (max. NDVI composite)


Roman et al. (2009) index


St

13.5467097098

Rcv

-0.108546175084

Rse

0.0

Rst

-0.00343949905554

Rsv

-0.109470315121


NDVI range @ 1km [-]

0.06

NDVI range @ 2km [-]

0.14

NDVI range @ 5km [-]

0.15

NDVI range @ 10km [-]

0.19

NDVI range @ 20km [-]

0.14


Variance slope @ 1 km

0.000452957781025

Variance slope @ 2 km

0.000461499841535

Variance slope @ 5 km

0.000385754522026

Variance slope @ 10 km

0.000209607420454

Variance slope @ 20 km

6.8406660851e-05


NDVI (min. NDVI composite)I


Roman et al. (2009) index


St

12.7181982414

Rcv

0.00919562811478

Rse

0.0

Rst

-0.0892898407744

Rsv

0.137396999921


NDVI range @ 1km [-]

0.08

NDVI range @ 2km [-]

0.15

NDVI range @ 5km [-]

0.16

NDVI range @ 10km [-]

0.18

NDVI range @ 20km [-]

0.17


NDVI slope @ 1 km

0.000571653186416

NDVI slope @ 2 km

0.000584946080595

NDVI slope @ 5 km

0.000473926448178

NDVI slope @ 10 km

0.000230423054364

NDVI slope @ 20 km

9.73351895294e-05


Temporal stability analysis

+000 deg (BHR)


BHR statistics

Temporal stability [1/decade]:


abs

rel


Weighted least square:

None


Ordinary least square:

None


Probabilities that GCOS criteria is met:

Weighted least square:

None %

Ordinary least square:

None %


DHR statistics

Temporal stability [1/decade]:


abs

rel


Weighted least square:

None


Ordinary least square:

None


Probabilities that GCOS criteria is met:

Weighted least square:

None %

Ordinary least square:

None %


+057/+063 deg (BHR)


BHR statistics

Temporal stability [1/decade]:


abs

rel


Weighted least square:

None


Ordinary least square:

None


Probabilities that GCOS criteria is met:

Weighted least square:

None %

Ordinary least square:

None %


DHR statistics

Temporal stability [1/decade]:


abs

rel


Weighted least square:

None


Ordinary least square:

None


Probabilities that GCOS criteria is met:

Weighted least square:

None %

Ordinary least square:

None %


Temporal anomaly analyis

The variance of the temporal anomalies provides an additional measure about the stability of the signal AFTER removal of the mean seasonal cylce.

+000 deg


+057/+063 deg