GEORGIA_TECH


Location

lon / lat [deg]: -84.3995 / 33.7802

Source network: AERONET


Geostationary surface albedo (GSA) data


“+000”


“+057/+063”


Landcover information (based on ESA CCI landcover data)


Landcover fractions @ 2km distance


Landcover fractions @ 20 km distance


Legend


Distance to open water bodies [km]:

1.84

Distance to urban areas [km]:

0.14


Radius: 1 km

Number of landcover classes:

1

Dominant landcover type:

190: urban areas

Fraction of dominant landcover type [%]:

100.0


Radius: 2 km

Number of landcover classes:

2

Dominant landcover type:

190: urban areas

Fraction of dominant landcover type [%]:

99.0


Radius: 5 km

Number of landcover classes:

1

Dominant landcover type:

190: urban areas

Fraction of dominant landcover type [%]:

100.0


Radius: 10 km

Number of landcover classes:

1

Dominant landcover type:

190: urban areas

Fraction of dominant landcover type [%]:

99.0


Radius: 20 km

Number of landcover classes:

3

Dominant landcover type:

190: urban areas

Fraction of dominant landcover type [%]:

93.0


Disturbances


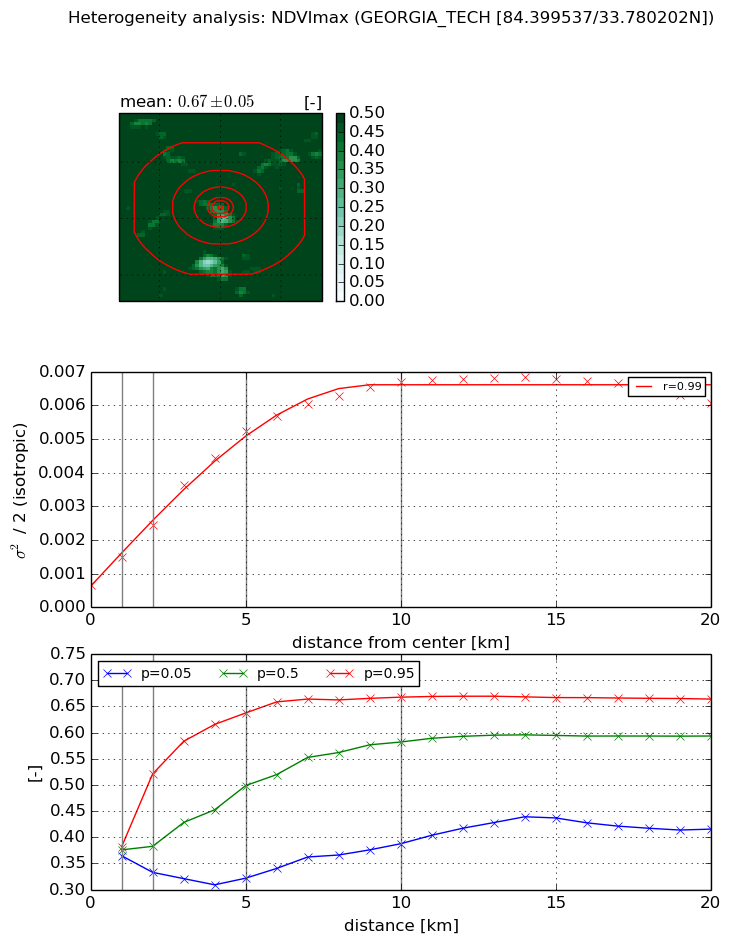
Heterogeneity analysis

The heterogeneity analysis provides information about the spatial and temporal heterogeneity of the site.

Topography


Roman et al. (2009) index


St

2.43978784382

Rcv

0.245763463356

Rse

0.0

Rst

-1.24880014562e-06

Rsv

-0.983850398683


Height range @ 1km [m]

28

Height range @ 2km [m]

39

Height range @ 5km [m]

65

Height range @ 10km [m]

-999

Height range @ 20km [m]

-999


Variance slope @ 1 km

131

Variance slope @ 2 km

87

Variance slope @ 5 km

66

Variance slope @ 10 km

-999

Variance slope @ 20 km

-999


NDVI (max. NDVI composite)


Roman et al. (2009) index


St

10.9536193924

Rcv

0.0448161348045

Rse

0.0

Rst

0.0497600597397

Rsv

-0.17930587973


NDVI range @ 1km [-]

0.02

NDVI range @ 2km [-]

0.19

NDVI range @ 5km [-]

0.32

NDVI range @ 10km [-]

0.28

NDVI range @ 20km [-]

0.25


Variance slope @ 1 km

0.000831237893155

Variance slope @ 2 km

0.000895754255925

Variance slope @ 5 km

0.000939864322653

Variance slope @ 10 km

0.000617217855955

Variance slope @ 20 km

0.000234951050706


NDVI (min. NDVI composite)I


Roman et al. (2009) index


St

12.7816714905

Rcv

0.121084556754

Rse

0.0

Rst

-0.0626758234652

Rsv

-0.0509507060602


NDVI range @ 1km [-]

0.01

NDVI range @ 2km [-]

0.1

NDVI range @ 5km [-]

0.21

NDVI range @ 10km [-]

0.23

NDVI range @ 20km [-]

0.18


NDVI slope @ 1 km

0.000449269544224

NDVI slope @ 2 km

0.000477066982277

NDVI slope @ 5 km

0.000495664463837

NDVI slope @ 10 km

0.000343329548399

NDVI slope @ 20 km

0.000135236238371


Temporal stability analysis

+000 deg (BHR)


BHR statistics

Temporal stability [1/decade]:


abs

rel


Weighted least square:

None


Ordinary least square:

None


Probabilities that GCOS criteria is met:

Weighted least square:

None %

Ordinary least square:

None %


DHR statistics

Temporal stability [1/decade]:


abs

rel


Weighted least square:

None


Ordinary least square:

None


Probabilities that GCOS criteria is met:

Weighted least square:

None %

Ordinary least square:

None %


+057/+063 deg (BHR)


BHR statistics

Temporal stability [1/decade]:


abs

rel


Weighted least square:

None


Ordinary least square:

None


Probabilities that GCOS criteria is met:

Weighted least square:

None %

Ordinary least square:

None %


DHR statistics

Temporal stability [1/decade]:


abs

rel


Weighted least square:

None


Ordinary least square:

None


Probabilities that GCOS criteria is met:

Weighted least square:

None %

Ordinary least square:

None %


Temporal anomaly analyis

The variance of the temporal anomalies provides an additional measure about the stability of the signal AFTER removal of the mean seasonal cylce.

+000 deg


+057/+063 deg