GOB


Location

lon / lat [deg]: 15.042 / -23.5614

Source network: BSRN


Geostationary surface albedo (GSA) data


“+000”


“+057/+063”


Landcover information (based on ESA CCI landcover data)


Landcover fractions @ 2km distance


Landcover fractions @ 20 km distance


Legend


Distance to open water bodies [km]:

34.91

Distance to urban areas [km]:

none in region


Radius: 1 km

Number of landcover classes:

2

Dominant landcover type:

200: bare areas

Fraction of dominant landcover type [%]:

76.0


Radius: 2 km

Number of landcover classes:

2

Dominant landcover type:

200: bare areas

Fraction of dominant landcover type [%]:

79.0


Radius: 5 km

Number of landcover classes:

2

Dominant landcover type:

200: bare areas

Fraction of dominant landcover type [%]:

88.0


Radius: 10 km

Number of landcover classes:

2

Dominant landcover type:

200: bare areas

Fraction of dominant landcover type [%]:

90.0


Radius: 20 km

Number of landcover classes:

2

Dominant landcover type:

200: bare areas

Fraction of dominant landcover type [%]:

90.0


Disturbances


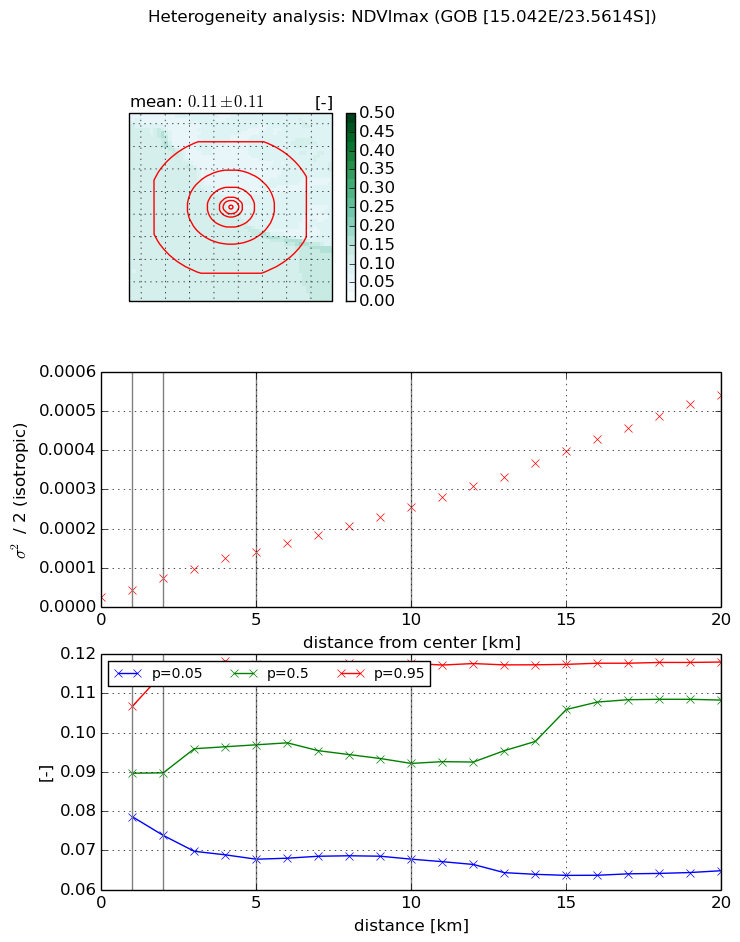
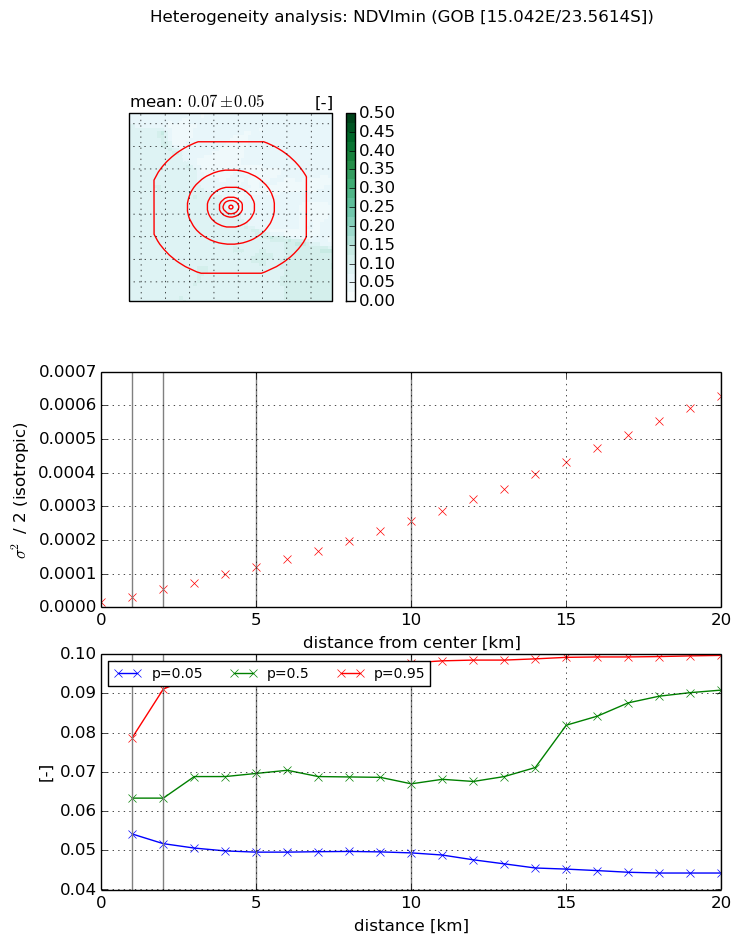
Heterogeneity analysis

The heterogeneity analysis provides information about the spatial and temporal heterogeneity of the site.

Topography


Roman et al. (2009) index


St

0.99799560437

Rcv

2.41436197359

Rse

0.0

Rst

-0.099671835033

Rsv

-0.491991455284


Height range @ 1km [m]

23

Height range @ 2km [m]

33

Height range @ 5km [m]

68

Height range @ 10km [m]

-999

Height range @ 20km [m]

-999


Variance slope @ 1 km

1188

Variance slope @ 2 km

666

Variance slope @ 5 km

303

Variance slope @ 10 km

-999

Variance slope @ 20 km

-999


NDVI (max. NDVI composite)


Roman et al. (2009) index


St

1.82071169464

Rcv

0.0513887310217

Rse

0.0

Rst

0.0236126527548

Rsv

1.57270594343


NDVI range @ 1km [-]

0.03

NDVI range @ 2km [-]

0.04

NDVI range @ 5km [-]

0.05

NDVI range @ 10km [-]

0.05

NDVI range @ 20km [-]

0.05


Variance slope @ 1 km

1.94036812275e-05

Variance slope @ 2 km

2.50391487727e-05

Variance slope @ 5 km

2.40850266077e-05

Variance slope @ 10 km

2.26355193521e-05

Variance slope @ 20 km

2.57752441109e-05


NDVI (min. NDVI composite)I


Roman et al. (2009) index


St

1.2449873548e-09

Rcv

0.0580928298221

Rse

0.0

Rst

0.152869468963

Rsv

2409663028.44


NDVI range @ 1km [-]

0.02

NDVI range @ 2km [-]

0.04

NDVI range @ 5km [-]

0.05

NDVI range @ 10km [-]

0.05

NDVI range @ 20km [-]

0.06


NDVI slope @ 1 km

1.35438331002e-05

NDVI slope @ 2 km

1.85017047383e-05

NDVI slope @ 5 km

2.11281193329e-05

NDVI slope @ 10 km

2.40566299746e-05

NDVI slope @ 20 km

3.10719658457e-05


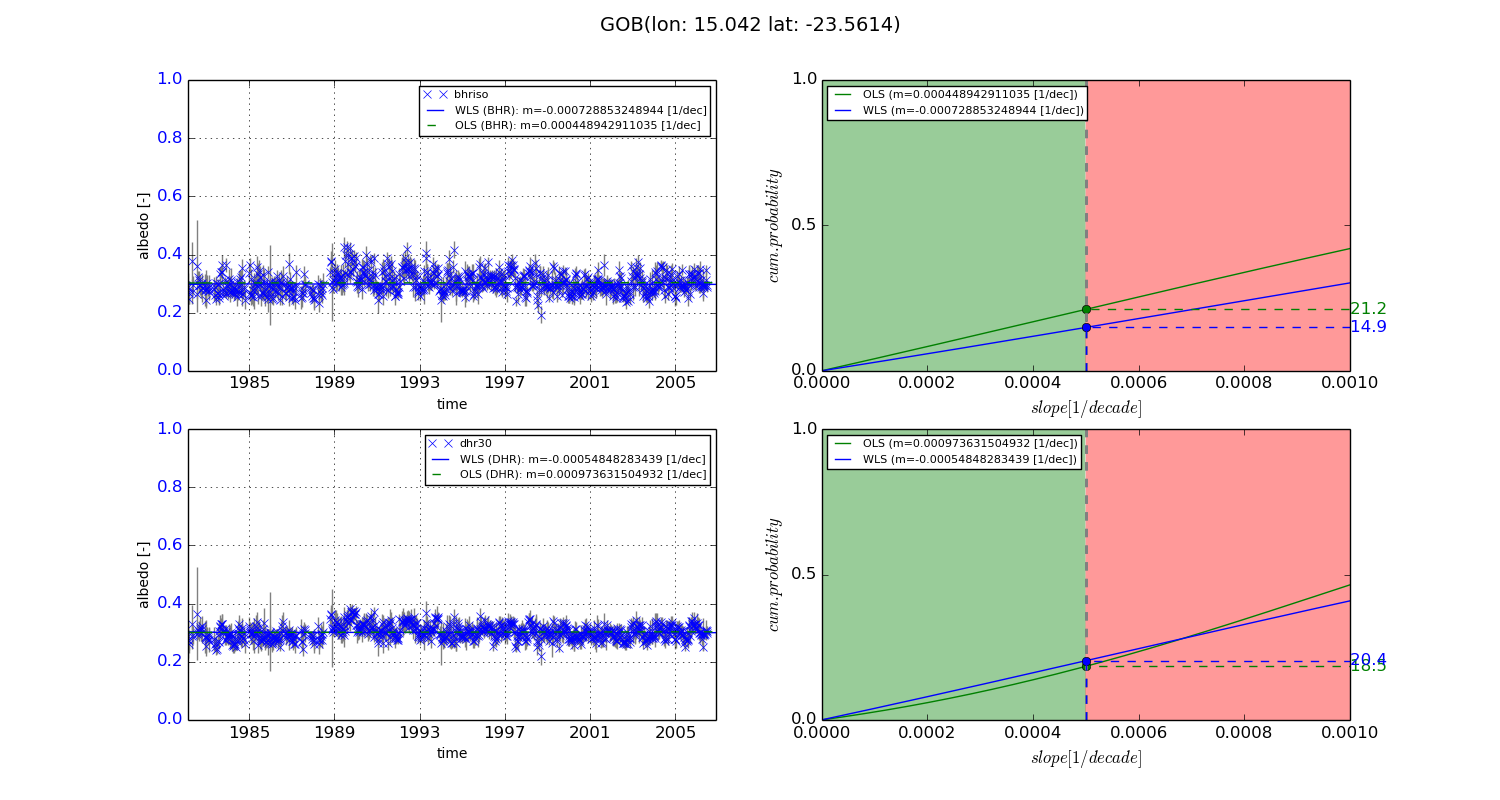
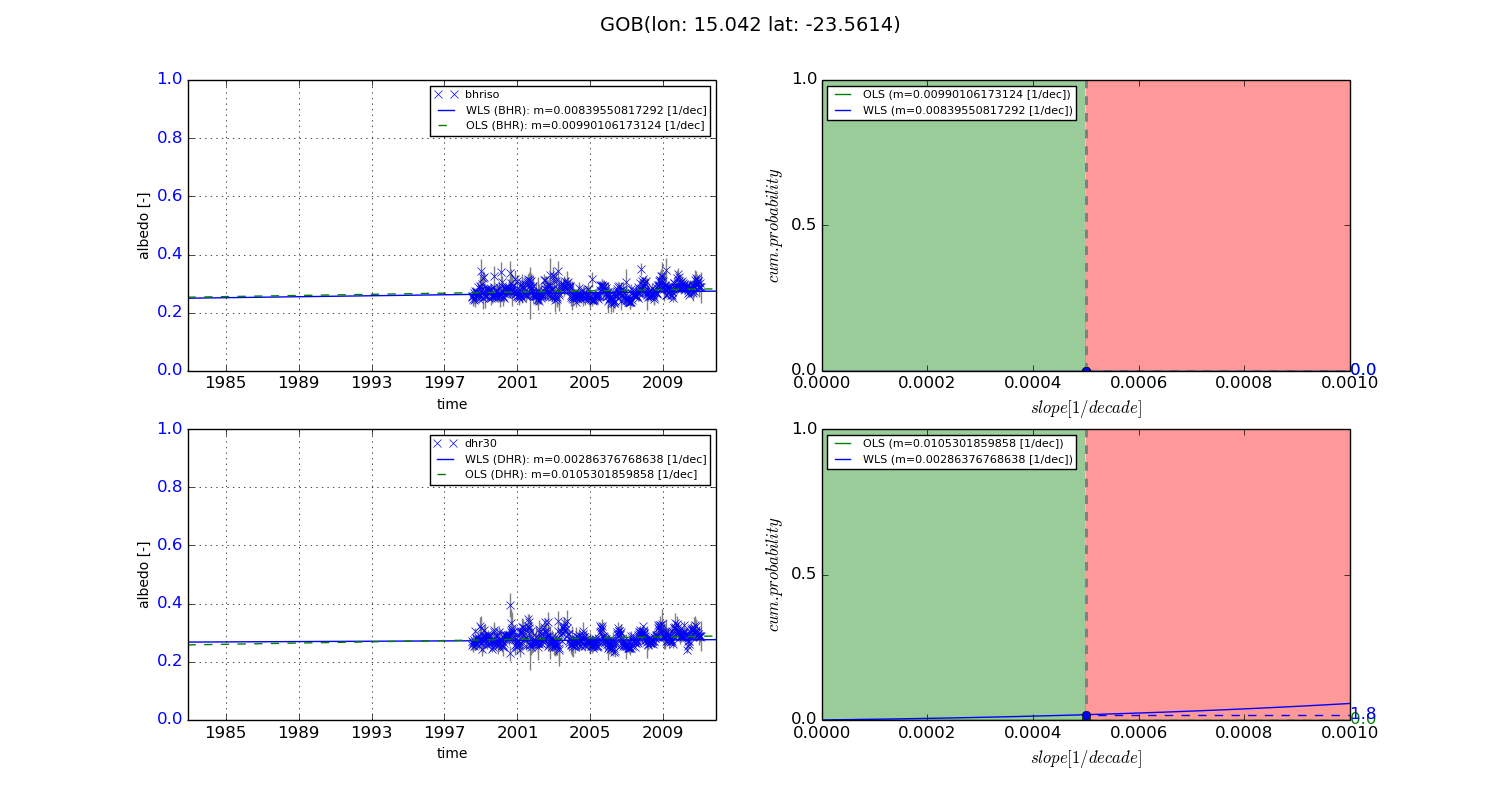
Temporal stability analysis

+000 deg (BHR)


BHR statistics

Temporal stability [1/decade]:


abs

rel


Weighted least square:

-0.000728853248944


Ordinary least square:

0.000448942911035


Probabilities that GCOS criteria is met:

Weighted least square:

14.9 %

Ordinary least square:

21.2 %


DHR statistics

Temporal stability [1/decade]:


abs

rel


Weighted least square:

-0.00054848283439


Ordinary least square:

0.000973631504932


Probabilities that GCOS criteria is met:

Weighted least square:

20.4 %

Ordinary least square:

18.5 %


+057/+063 deg (BHR)


BHR statistics

Temporal stability [1/decade]:


abs

rel


Weighted least square:

0.00839550817292


Ordinary least square:

0.00990106173124


Probabilities that GCOS criteria is met:

Weighted least square:

0.0 %

Ordinary least square:

0.0 %


DHR statistics

Temporal stability [1/decade]:


abs

rel


Weighted least square:

0.00286376768638


Ordinary least square:

0.0105301859858


Probabilities that GCOS criteria is met:

Weighted least square:

1.8 %

Ordinary least square:

0.0 %


Temporal anomaly analyis

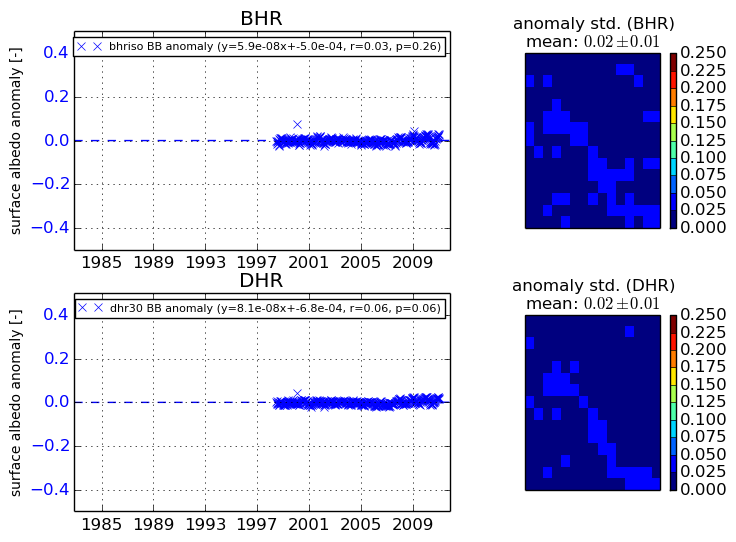
The variance of the temporal anomalies provides an additional measure about the stability of the signal AFTER removal of the mean seasonal cylce.
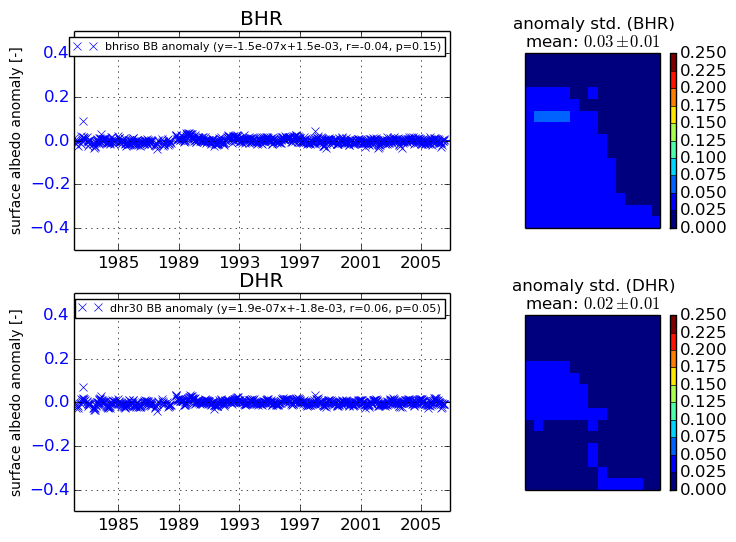
+000 deg


+057/+063 deg