GOLDSTONE


Location

lon / lat [deg]: -116.7917 / 35.2333

Source network: AERONET


Geostationary surface albedo (GSA) data


“+000”


“+057/+063”


Landcover information (based on ESA CCI landcover data)


Landcover fractions @ 2km distance


Landcover fractions @ 20 km distance


Legend


Distance to open water bodies [km]:

11.99

Distance to urban areas [km]:

7.91


Radius: 1 km

Number of landcover classes:

1

Dominant landcover type:

120: Shrubland

Fraction of dominant landcover type [%]:

100.0


Radius: 2 km

Number of landcover classes:

1

Dominant landcover type:

120: Shrubland

Fraction of dominant landcover type [%]:

100.0


Radius: 5 km

Number of landcover classes:

1

Dominant landcover type:

120: Shrubland

Fraction of dominant landcover type [%]:

100.0


Radius: 10 km

Number of landcover classes:

2

Dominant landcover type:

120: Shrubland

Fraction of dominant landcover type [%]:

98.0


Radius: 20 km

Number of landcover classes:

2

Dominant landcover type:

120: Shrubland

Fraction of dominant landcover type [%]:

94.0


Disturbances


Heterogeneity analysis

The heterogeneity analysis provides information about the spatial and temporal heterogeneity of the site.

Topography


Roman et al. (2009) index


St

1.00580039686e-10

Rcv

0.284004231796

Rse

0.0

Rst

3.50850281272e-07

Rsv

29826991611.2


Height range @ 1km [m]

57

Height range @ 2km [m]

162

Height range @ 5km [m]

319

Height range @ 10km [m]

-999

Height range @ 20km [m]

-999


Variance slope @ 1 km

1458

Variance slope @ 2 km

1873

Variance slope @ 5 km

2356

Variance slope @ 10 km

-999

Variance slope @ 20 km

-999


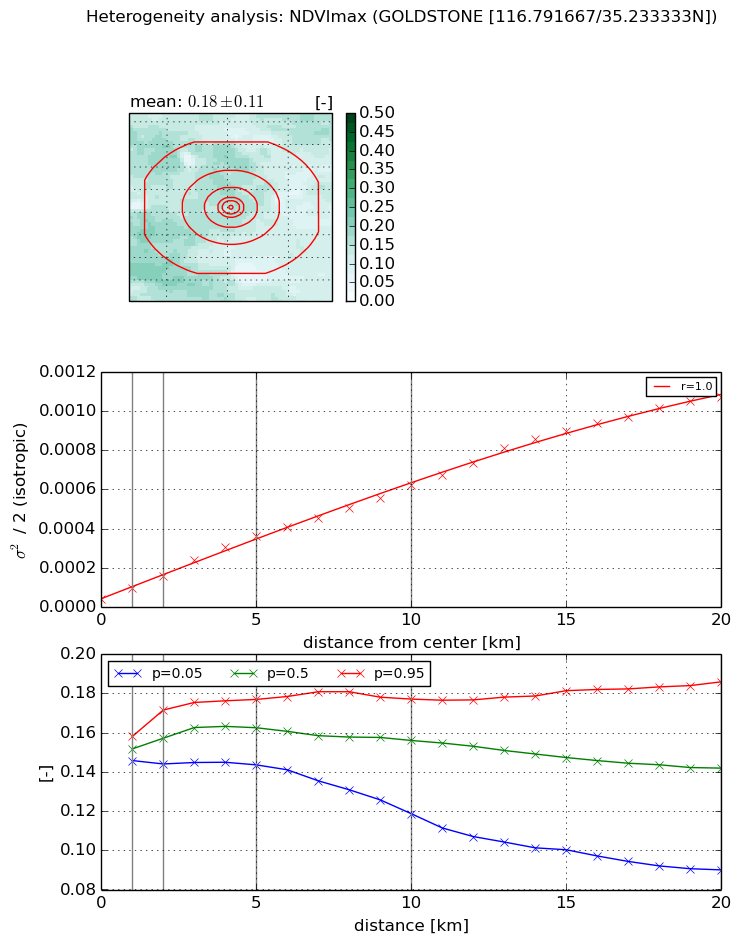
NDVI (max. NDVI composite)


Roman et al. (2009) index


St

2.15764546685

Rcv

0.145449070487

Rse

0.0

Rst

-0.244955448478

Rsv

-0.999999996556


NDVI range @ 1km [-]

0.01

NDVI range @ 2km [-]

0.03

NDVI range @ 5km [-]

0.03

NDVI range @ 10km [-]

0.06

NDVI range @ 20km [-]

0.1


Variance slope @ 1 km

5.69942943102e-05

Variance slope @ 2 km

5.97525241567e-05

Variance slope @ 5 km

6.56792062765e-05

Variance slope @ 10 km

5.75232413079e-05

Variance slope @ 20 km

5.28954436768e-05


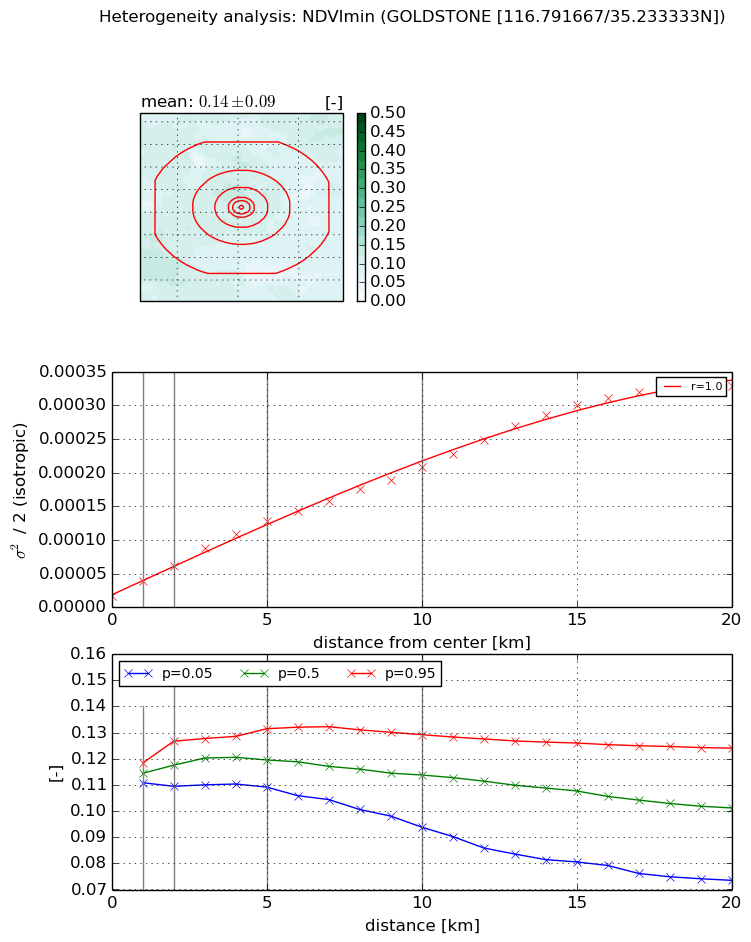
NDVI (min. NDVI composite)I


Roman et al. (2009) index


St

2.04972114652

Rcv

0.205785318326

Rse

0.0

Rst

-0.257828704295

Rsv

-0.999999701174


NDVI range @ 1km [-]

0.01

NDVI range @ 2km [-]

0.02

NDVI range @ 5km [-]

0.02

NDVI range @ 10km [-]

0.04

NDVI range @ 20km [-]

0.05


NDVI slope @ 1 km

2.15653457048e-05

NDVI slope @ 2 km

2.21893009438e-05

NDVI slope @ 5 km

2.26856976995e-05

NDVI slope @ 10 km

1.88857642126e-05

NDVI slope @ 20 km

1.64203742889e-05


Temporal stability analysis

+000 deg (BHR)


BHR statistics

Temporal stability [1/decade]:


abs

rel


Weighted least square:

None


Ordinary least square:

None


Probabilities that GCOS criteria is met:

Weighted least square:

None %

Ordinary least square:

None %


DHR statistics

Temporal stability [1/decade]:


abs

rel


Weighted least square:

None


Ordinary least square:

None


Probabilities that GCOS criteria is met:

Weighted least square:

None %

Ordinary least square:

None %


+057/+063 deg (BHR)


BHR statistics

Temporal stability [1/decade]:


abs

rel


Weighted least square:

None


Ordinary least square:

None


Probabilities that GCOS criteria is met:

Weighted least square:

None %

Ordinary least square:

None %


DHR statistics

Temporal stability [1/decade]:


abs

rel


Weighted least square:

None


Ordinary least square:

None


Probabilities that GCOS criteria is met:

Weighted least square:

None %

Ordinary least square:

None %


Temporal anomaly analyis

The variance of the temporal anomalies provides an additional measure about the stability of the signal AFTER removal of the mean seasonal cylce.

+000 deg


+057/+063 deg