GORDO_REST


Location

lon / lat [deg]: -55.993 / -15.401

Source network: AERONET


Geostationary surface albedo (GSA) data


“+000”


“+057/+063”


Landcover information (based on ESA CCI landcover data)


Landcover fractions @ 2km distance


Landcover fractions @ 20 km distance


Legend


Distance to open water bodies [km]:

3.99

Distance to urban areas [km]:

13.61


Radius: 1 km

Number of landcover classes:

3

Dominant landcover type:

120: Shrubland

Fraction of dominant landcover type [%]:

83.0


Radius: 2 km

Number of landcover classes:

4

Dominant landcover type:

120: Shrubland

Fraction of dominant landcover type [%]:

78.0


Radius: 5 km

Number of landcover classes:

4

Dominant landcover type:

120: Shrubland

Fraction of dominant landcover type [%]:

83.0


Radius: 10 km

Number of landcover classes:

6

Dominant landcover type:

120: Shrubland

Fraction of dominant landcover type [%]:

81.0


Radius: 20 km

Number of landcover classes:

7

Dominant landcover type:

120: Shrubland

Fraction of dominant landcover type [%]:

63.0


Disturbances


Heterogeneity analysis

The heterogeneity analysis provides information about the spatial and temporal heterogeneity of the site.

Topography


Roman et al. (2009) index


St

8.41021507575

Rcv

0.262912632418

Rse

0.0

Rst

0.0084878890897

Rsv

0.0853085487101


Height range @ 1km [m]

30

Height range @ 2km [m]

35

Height range @ 5km [m]

53

Height range @ 10km [m]

-999

Height range @ 20km [m]

-999


Variance slope @ 1 km

164

Variance slope @ 2 km

120

Variance slope @ 5 km

91

Variance slope @ 10 km

-999

Variance slope @ 20 km

-999


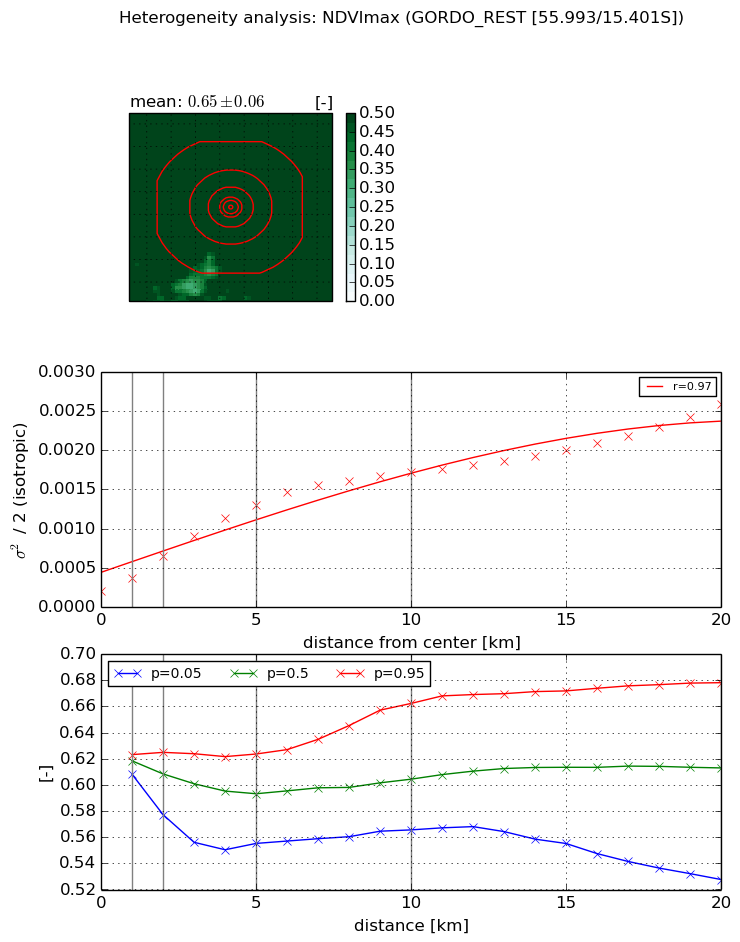
NDVI (max. NDVI composite)


Roman et al. (2009) index


St

2.2106081557

Rcv

0.0436787036071

Rse

0.0

Rst

-0.243331456597

Rsv

1.07008245355


NDVI range @ 1km [-]

0.02

NDVI range @ 2km [-]

0.05

NDVI range @ 5km [-]

0.07

NDVI range @ 10km [-]

0.1

NDVI range @ 20km [-]

0.15


Variance slope @ 1 km

0.000170882164715

Variance slope @ 2 km

0.00022341318471

Variance slope @ 5 km

0.000229309487654

Variance slope @ 10 km

0.000157312963173

Variance slope @ 20 km

9.98015936054e-05


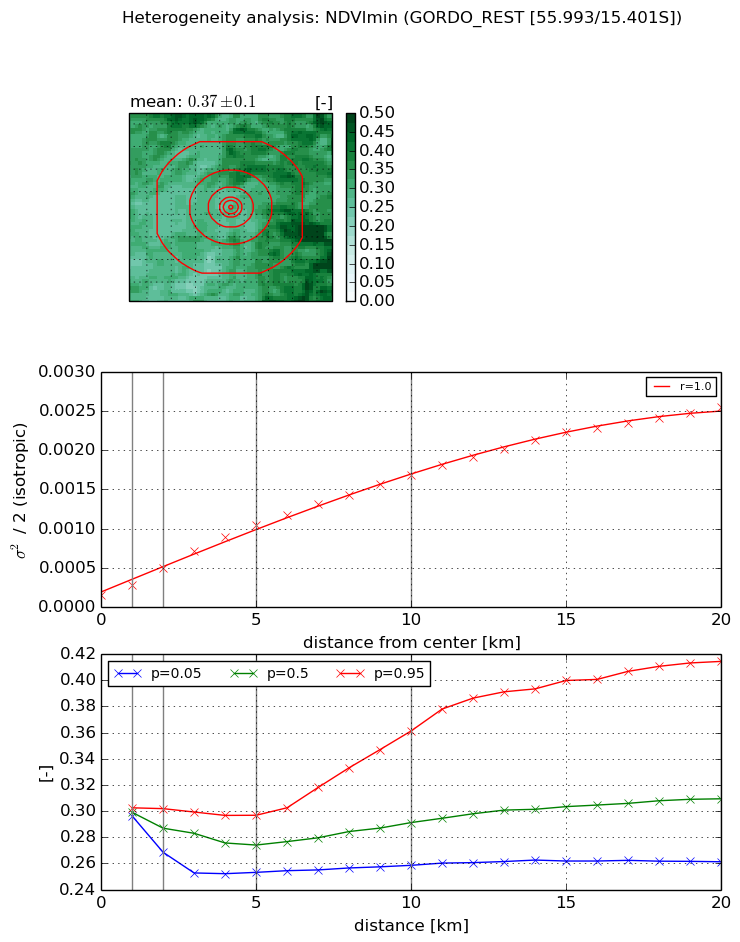
NDVI (min. NDVI composite)I


Roman et al. (2009) index


St

3.07129965231

Rcv

0.0403623659953

Rse

0.0

Rst

-0.318751316948

Rsv

0.617671502359


NDVI range @ 1km [-]

0.01

NDVI range @ 2km [-]

0.03

NDVI range @ 5km [-]

0.04

NDVI range @ 10km [-]

0.1

NDVI range @ 20km [-]

0.15


NDVI slope @ 1 km

0.0001327102411

NDVI slope @ 2 km

0.000176218619902

NDVI slope @ 5 km

0.000186144791465

NDVI slope @ 10 km

0.000155484679356

NDVI slope @ 20 km

0.000119335889629


Temporal stability analysis

+000 deg (BHR)


BHR statistics

Temporal stability [1/decade]:


abs

rel


Weighted least square:

-99999.0


Ordinary least square:

-99999.0


Probabilities that GCOS criteria is met:

Weighted least square:

-99999.0 %

Ordinary least square:

-99999.0 %


DHR statistics

Temporal stability [1/decade]:


abs

rel


Weighted least square:

-99999.0


Ordinary least square:

-99999.0


Probabilities that GCOS criteria is met:

Weighted least square:

-99999.0 %

Ordinary least square:

-99999.0 %


+057/+063 deg (BHR)


BHR statistics

Temporal stability [1/decade]:


abs

rel


Weighted least square:

None


Ordinary least square:

None


Probabilities that GCOS criteria is met:

Weighted least square:

None %

Ordinary least square:

None %


DHR statistics

Temporal stability [1/decade]:


abs

rel


Weighted least square:

None


Ordinary least square:

None


Probabilities that GCOS criteria is met:

Weighted least square:

None %

Ordinary least square:

None %


Temporal anomaly analyis

The variance of the temporal anomalies provides an additional measure about the stability of the signal AFTER removal of the mean seasonal cylce.

+000 deg


+057/+063 deg