GRAND_MORIN


Location

lon / lat [deg]: 2.96 / 48.455

Source network: EOS_LAND


Geostationary surface albedo (GSA) data


“+000”


“+057/+063”


Landcover information (based on ESA CCI landcover data)


Landcover fractions @ 2km distance


Landcover fractions @ 20 km distance


Legend


Distance to open water bodies [km]:

6.97

Distance to urban areas [km]:

1.34


Radius: 1 km

Number of landcover classes:

2

Dominant landcover type:

60: Tree cover, broadleaved, decidous

Fraction of dominant landcover type [%]:

90.0


Radius: 2 km

Number of landcover classes:

4

Dominant landcover type:

60: Tree cover, broadleaved, decidous

Fraction of dominant landcover type [%]:

66.0


Radius: 5 km

Number of landcover classes:

4

Dominant landcover type:

60: Tree cover, broadleaved, decidous

Fraction of dominant landcover type [%]:

49.0


Radius: 10 km

Number of landcover classes:

5

Dominant landcover type:

10: cropland, rainfed

Fraction of dominant landcover type [%]:

52.0


Radius: 20 km

Number of landcover classes:

5

Dominant landcover type:

10: cropland, rainfed

Fraction of dominant landcover type [%]:

64.0


Disturbances


Heterogeneity analysis

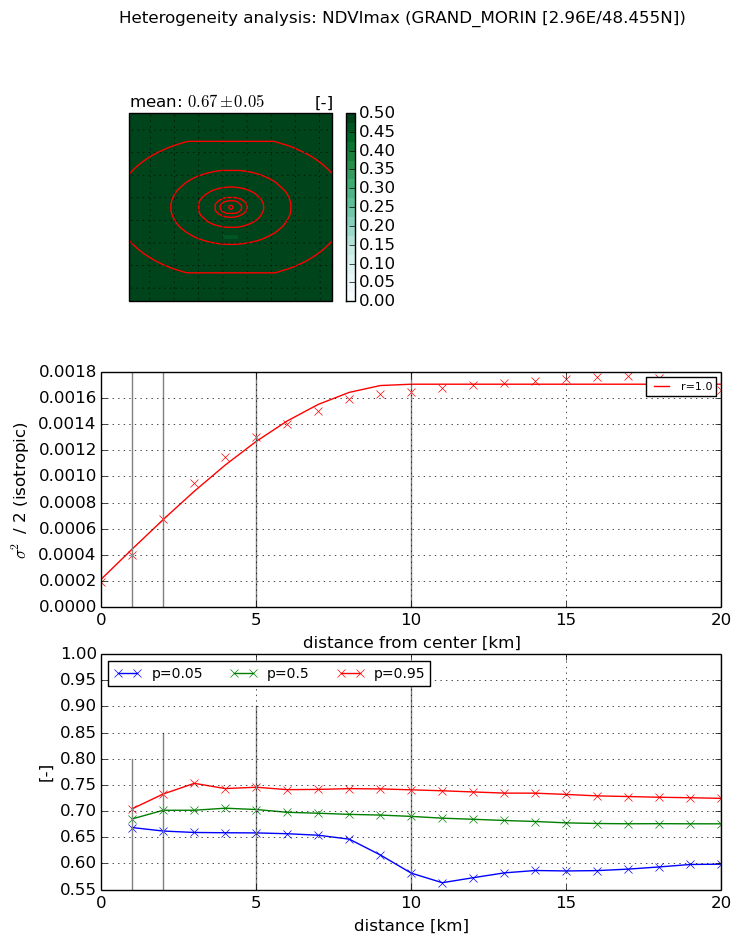
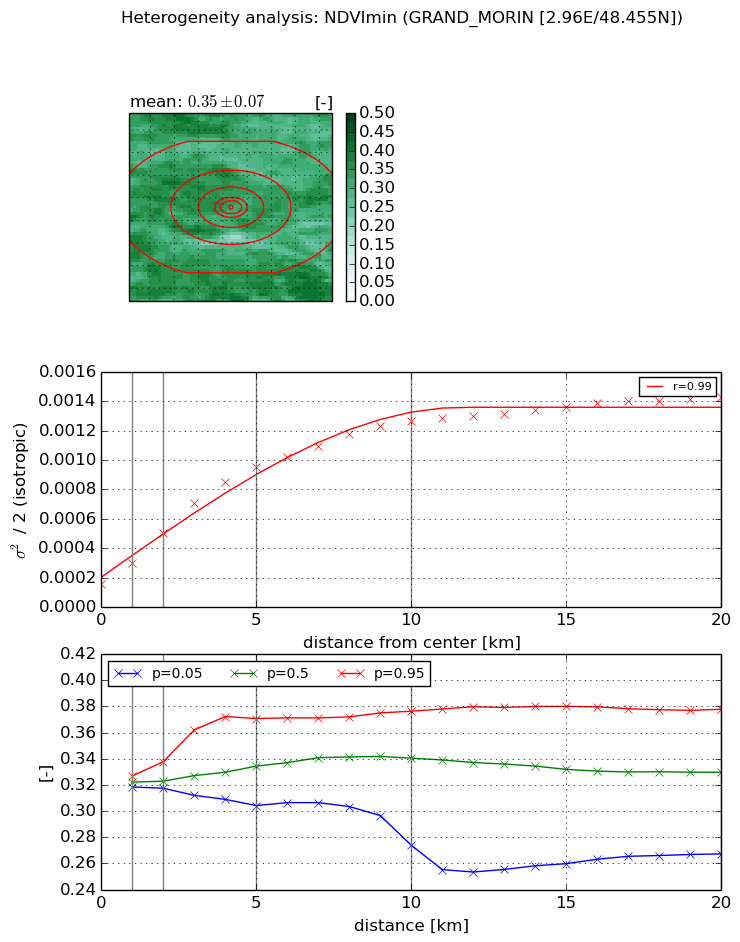
The heterogeneity analysis provides information about the spatial and temporal heterogeneity of the site.

Topography


Roman et al. (2009) index


St

7.31418912219

Rcv

0.0328961055832

Rse

0.0

Rst

0.0935518699131

Rsv

-0.283713691078


Height range @ 1km [m]

22

Height range @ 2km [m]

29

Height range @ 5km [m]

34

Height range @ 10km [m]

-999

Height range @ 20km [m]

-999


Variance slope @ 1 km

52

Variance slope @ 2 km

49

Variance slope @ 5 km

28

Variance slope @ 10 km

-999

Variance slope @ 20 km

-999


NDVI (max. NDVI composite)


Roman et al. (2009) index


St

0.920094822905

Rcv

-0.0278951293958

Rse

0.0

Rst

-0.5719371299

Rsv

2.66070124803


NDVI range @ 1km [-]

0.04

NDVI range @ 2km [-]

0.07

NDVI range @ 5km [-]

0.09

NDVI range @ 10km [-]

0.16

NDVI range @ 20km [-]

0.13


Variance slope @ 1 km

0.000206128171782

Variance slope @ 2 km

0.000240487855242

Variance slope @ 5 km

0.000230160176268

Variance slope @ 10 km

0.000148129204641

Variance slope @ 20 km

6.34747513048e-05


NDVI (min. NDVI composite)I


Roman et al. (2009) index


St

7.13575946338

Rcv

0.285910255988

Rse

0.0

Rst

-0.0738086183309

Rsv

0.0606988843507


NDVI range @ 1km [-]

0.01

NDVI range @ 2km [-]

0.02

NDVI range @ 5km [-]

0.07

NDVI range @ 10km [-]

0.1

NDVI range @ 20km [-]

0.11


NDVI slope @ 1 km

0.000144846531393

NDVI slope @ 2 km

0.000173662023886

NDVI slope @ 5 km

0.000167480645217

NDVI slope @ 10 km

0.000110956385936

NDVI slope @ 20 km

5.4958808494e-05


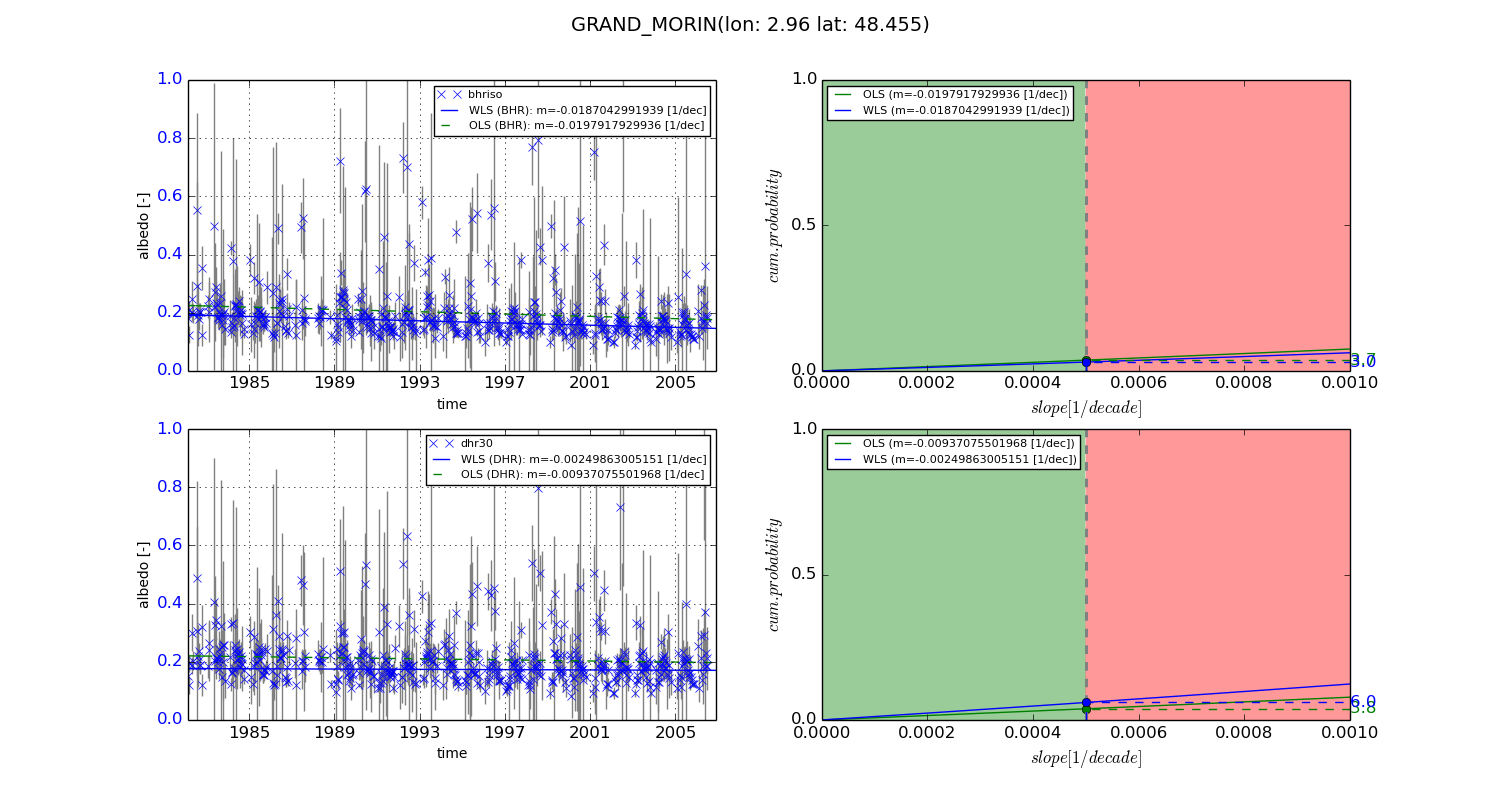
Temporal stability analysis

+000 deg (BHR)


BHR statistics

Temporal stability [1/decade]:


abs

rel


Weighted least square:

-0.0187042991939


Ordinary least square:

-0.0197917929936


Probabilities that GCOS criteria is met:

Weighted least square:

3.0 %

Ordinary least square:

3.7 %


DHR statistics

Temporal stability [1/decade]:


abs

rel


Weighted least square:

-0.00249863005151


Ordinary least square:

-0.00937075501968


Probabilities that GCOS criteria is met:

Weighted least square:

6.0 %

Ordinary least square:

3.8 %


+057/+063 deg (BHR)


BHR statistics

Temporal stability [1/decade]:


abs

rel


Weighted least square:

-99999.0


Ordinary least square:

-99999.0


Probabilities that GCOS criteria is met:

Weighted least square:

-99999.0 %

Ordinary least square:

-99999.0 %


DHR statistics

Temporal stability [1/decade]:


abs

rel


Weighted least square:

-99999.0


Ordinary least square:

-99999.0


Probabilities that GCOS criteria is met:

Weighted least square:

-99999.0 %

Ordinary least square:

-99999.0 %


Temporal anomaly analyis

The variance of the temporal anomalies provides an additional measure about the stability of the signal AFTER removal of the mean seasonal cylce.
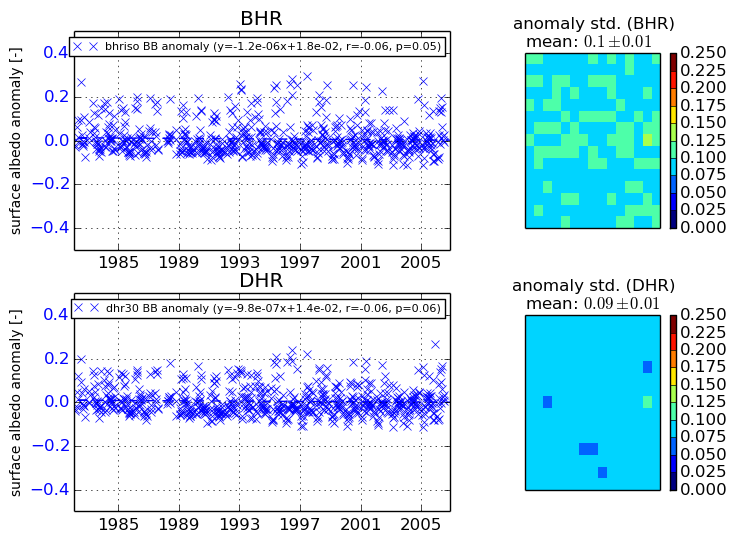
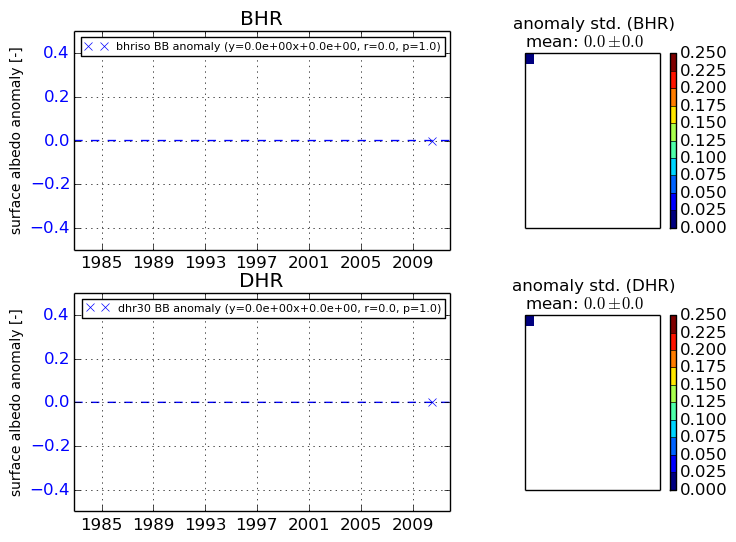
+000 deg


+057/+063 deg