GUAL_PAHARI


Location

lon / lat [deg]: 77.15 / 28.4264

Source network: AERONET


Geostationary surface albedo (GSA) data


“+000”


“+057/+063”


Landcover information (based on ESA CCI landcover data)


Landcover fractions @ 2km distance


Landcover fractions @ 20 km distance


Legend


Distance to open water bodies [km]:

5.92

Distance to urban areas [km]:

1.6


Radius: 1 km

Number of landcover classes:

2

Dominant landcover type:

20: cropland, irrigated or post-flooded

Fraction of dominant landcover type [%]:

89.0


Radius: 2 km

Number of landcover classes:

3

Dominant landcover type:

20: cropland, irrigated or post-flooded

Fraction of dominant landcover type [%]:

79.0


Radius: 5 km

Number of landcover classes:

4

Dominant landcover type:

20: cropland, irrigated or post-flooded

Fraction of dominant landcover type [%]:

64.0


Radius: 10 km

Number of landcover classes:

6

Dominant landcover type:

20: cropland, irrigated or post-flooded

Fraction of dominant landcover type [%]:

46.0


Radius: 20 km

Number of landcover classes:

6

Dominant landcover type:

190: urban areas

Fraction of dominant landcover type [%]:

41.0


Disturbances


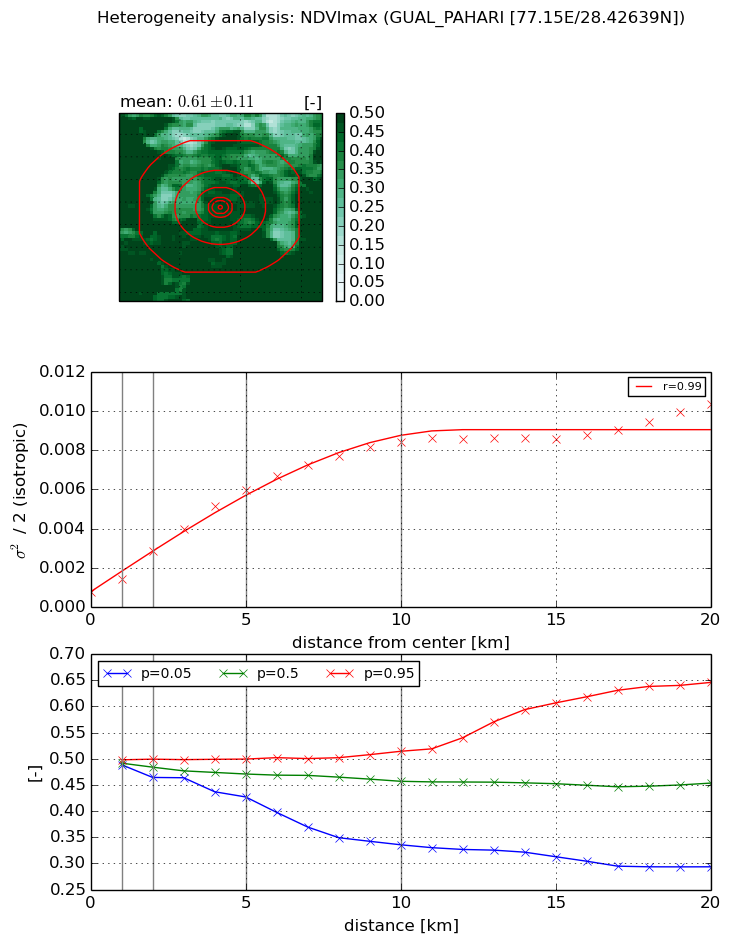
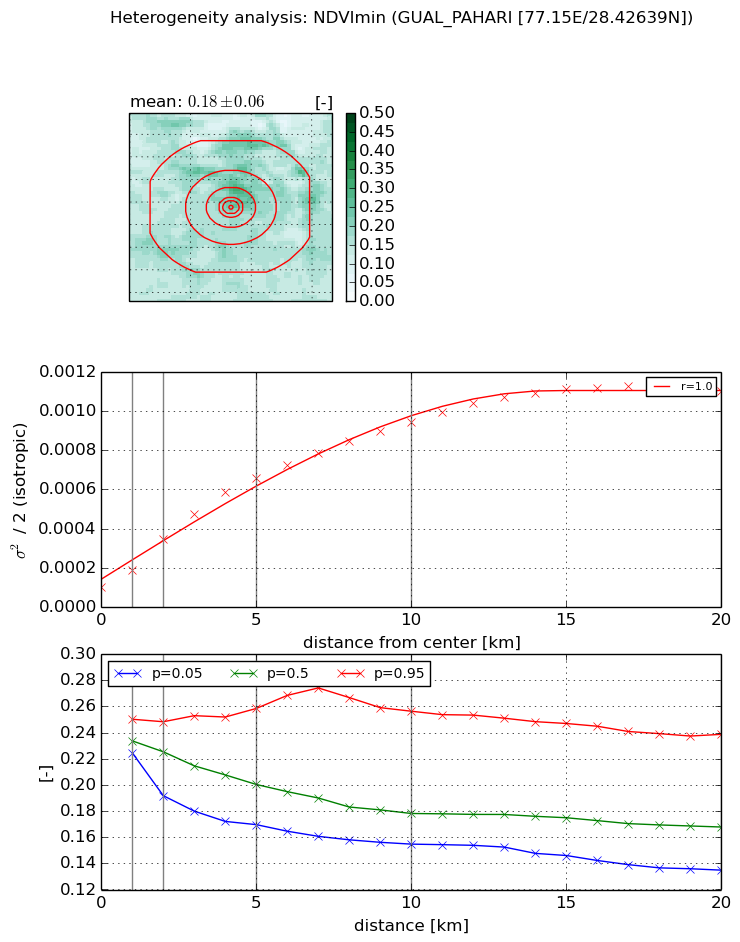
Heterogeneity analysis

The heterogeneity analysis provides information about the spatial and temporal heterogeneity of the site.

Topography


Roman et al. (2009) index


St

4.99778345776

Rcv

0.184866252709

Rse

0.0

Rst

-0.121621289675

Rsv

0.293778560651


Height range @ 1km [m]

16

Height range @ 2km [m]

37

Height range @ 5km [m]

53

Height range @ 10km [m]

-999

Height range @ 20km [m]

-999


Variance slope @ 1 km

127

Variance slope @ 2 km

107

Variance slope @ 5 km

66

Variance slope @ 10 km

-999

Variance slope @ 20 km

-999


NDVI (max. NDVI composite)


Roman et al. (2009) index


St

nan

Rcv

nan

Rse

nan

Rst

nan

Rsv

nan


NDVI range @ 1km [-]

0.01

NDVI range @ 2km [-]

0.03

NDVI range @ 5km [-]

0.07

NDVI range @ 10km [-]

0.18

NDVI range @ 20km [-]

0.35


Variance slope @ 1 km

0.000684422416506

Variance slope @ 2 km

0.00104405747354

Variance slope @ 5 km

0.00109994177243

Variance slope @ 10 km

0.000799512320699

Variance slope @ 20 km

0.000402446648231


NDVI (min. NDVI composite)I


Roman et al. (2009) index


St

1.73570079107

Rcv

0.432314033337

Rse

0.0

Rst

-0.296094613942

Rsv

-0.999999852294


NDVI range @ 1km [-]

0.03

NDVI range @ 2km [-]

0.06

NDVI range @ 5km [-]

0.09

NDVI range @ 10km [-]

0.1

NDVI range @ 20km [-]

0.1


NDVI slope @ 1 km

8.84357870552e-05

NDVI slope @ 2 km

0.000124283361139

NDVI slope @ 5 km

0.000117249492621

NDVI slope @ 10 km

8.45497540096e-05

NDVI slope @ 20 km

4.84010111374e-05


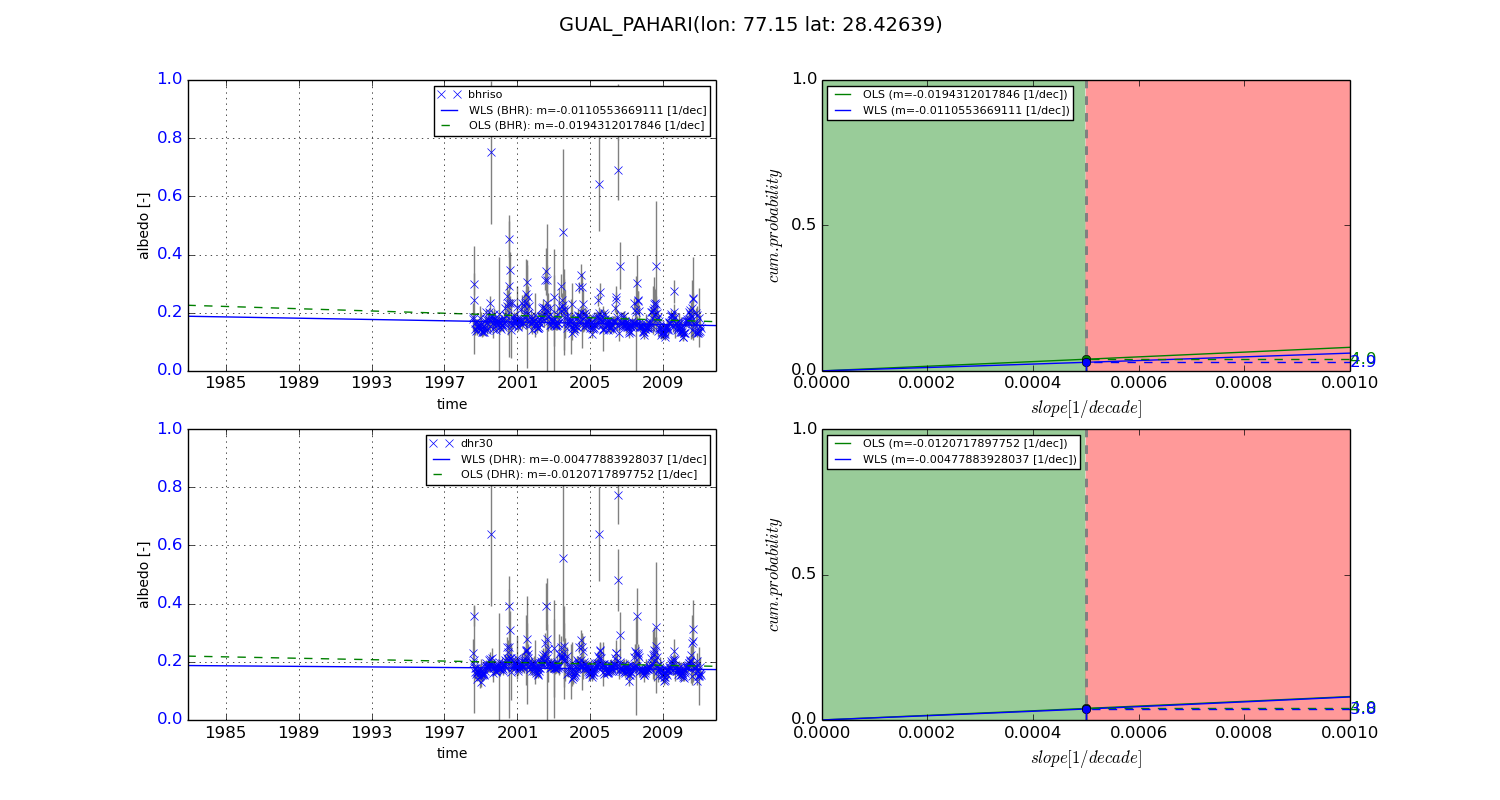
Temporal stability analysis

+000 deg (BHR)


BHR statistics

Temporal stability [1/decade]:


abs

rel


Weighted least square:

-99999.0


Ordinary least square:

-99999.0


Probabilities that GCOS criteria is met:

Weighted least square:

-99999.0 %

Ordinary least square:

-99999.0 %


DHR statistics

Temporal stability [1/decade]:


abs

rel


Weighted least square:

-99999.0


Ordinary least square:

-99999.0


Probabilities that GCOS criteria is met:

Weighted least square:

-99999.0 %

Ordinary least square:

-99999.0 %


+057/+063 deg (BHR)


BHR statistics

Temporal stability [1/decade]:


abs

rel


Weighted least square:

-0.0110553669111


Ordinary least square:

-0.0194312017846


Probabilities that GCOS criteria is met:

Weighted least square:

2.9 %

Ordinary least square:

4.0 %


DHR statistics

Temporal stability [1/decade]:


abs

rel


Weighted least square:

-0.00477883928037


Ordinary least square:

-0.0120717897752


Probabilities that GCOS criteria is met:

Weighted least square:

3.8 %

Ordinary least square:

4.0 %


Temporal anomaly analyis

The variance of the temporal anomalies provides an additional measure about the stability of the signal AFTER removal of the mean seasonal cylce.

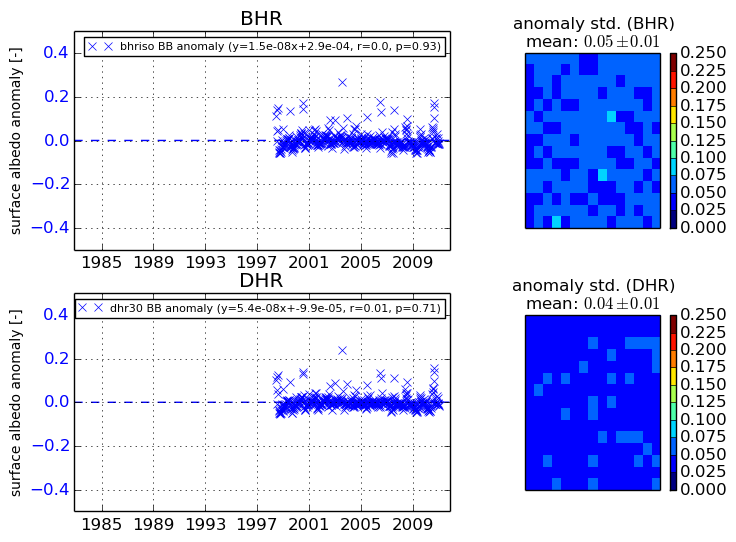
+000 deg


+057/+063 deg