HADA_EL-SHAM


Location

lon / lat [deg]: 39.7289 / 21.802

Source network: AERONET


Geostationary surface albedo (GSA) data


“+000”


“+057/+063”


Landcover information (based on ESA CCI landcover data)


Landcover fractions @ 2km distance


Landcover fractions @ 20 km distance


Legend


Distance to open water bodies [km]:

none in region

Distance to urban areas [km]:

16.21


Radius: 1 km

Number of landcover classes:

3

Dominant landcover type:

10: cropland, rainfed

Fraction of dominant landcover type [%]:

43.0


Radius: 2 km

Number of landcover classes:

3

Dominant landcover type:

150: Sparse vegetation (tree, shrub, herbaceous cover) (<15%)

Fraction of dominant landcover type [%]:

50.0


Radius: 5 km

Number of landcover classes:

3

Dominant landcover type:

150: Sparse vegetation (tree, shrub, herbaceous cover) (<15%)

Fraction of dominant landcover type [%]:

70.0


Radius: 10 km

Number of landcover classes:

2

Dominant landcover type:

150: Sparse vegetation (tree, shrub, herbaceous cover) (<15%)

Fraction of dominant landcover type [%]:

81.0


Radius: 20 km

Number of landcover classes:

2

Dominant landcover type:

150: Sparse vegetation (tree, shrub, herbaceous cover) (<15%)

Fraction of dominant landcover type [%]:

67.0


Disturbances


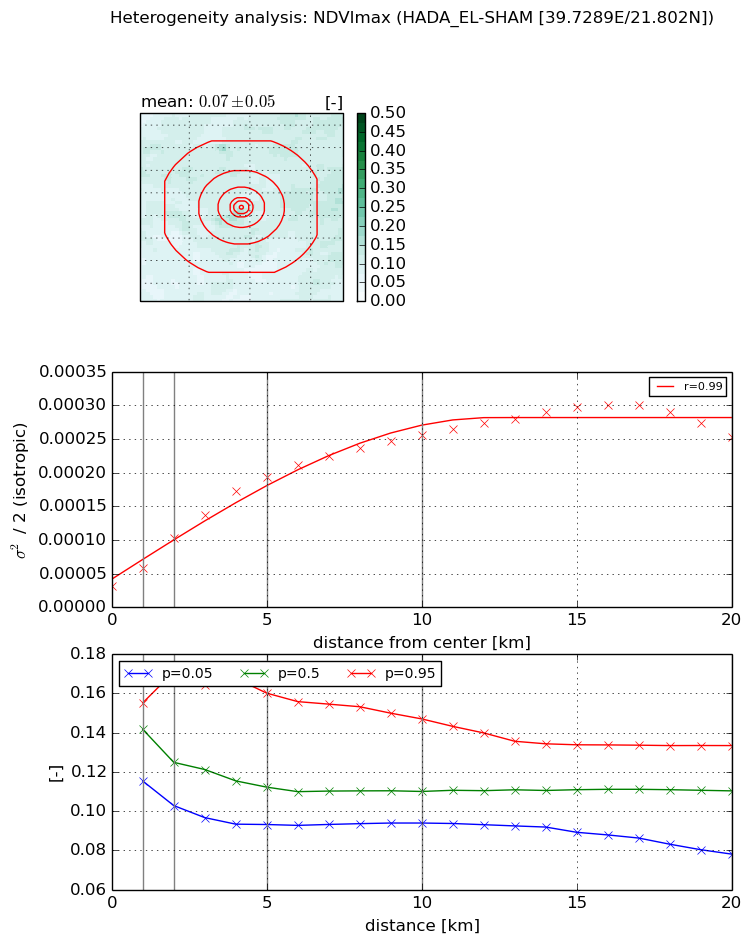
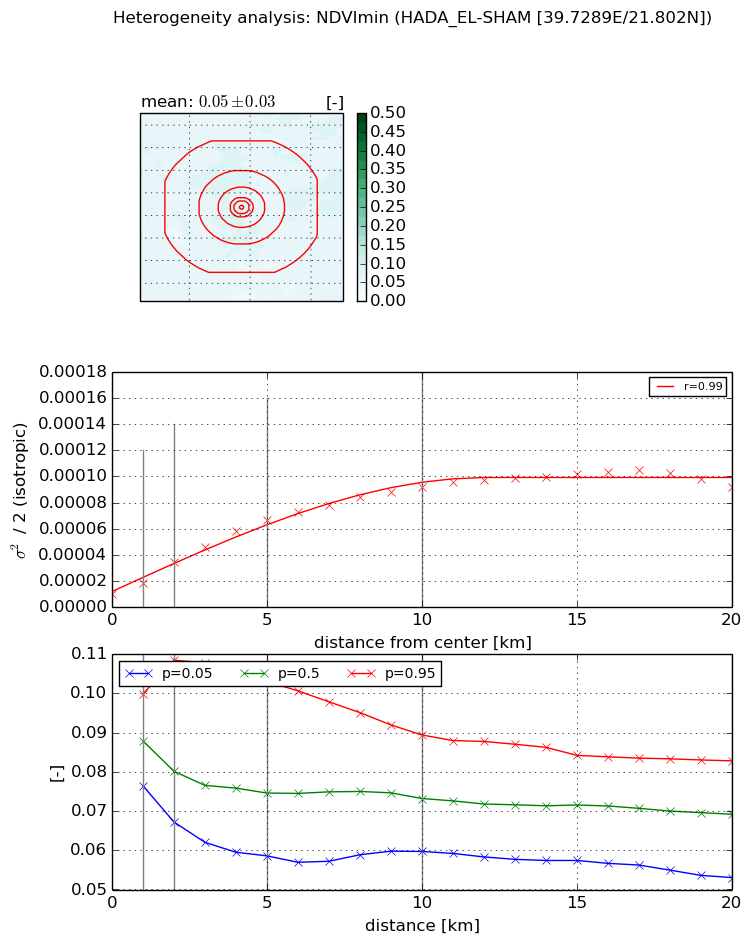
Heterogeneity analysis

The heterogeneity analysis provides information about the spatial and temporal heterogeneity of the site.

Topography


Roman et al. (2009) index


St

0.000184231096908

Rcv

0.465101296452

Rse

0.0

Rst

0.0149927659213

Rsv

16283.4157865


Height range @ 1km [m]

9

Height range @ 2km [m]

52

Height range @ 5km [m]

208

Height range @ 10km [m]

-999

Height range @ 20km [m]

-999


Variance slope @ 1 km

1749

Variance slope @ 2 km

1641

Variance slope @ 5 km

1249

Variance slope @ 10 km

-999

Variance slope @ 20 km

-999


NDVI (max. NDVI composite)


Roman et al. (2009) index


St

3.56596842347

Rcv

0.04915353205

Rse

0.0

Rst

-0.22033512458

Rsv

0.571797536556


NDVI range @ 1km [-]

0.04

NDVI range @ 2km [-]

0.07

NDVI range @ 5km [-]

0.07

NDVI range @ 10km [-]

0.05

NDVI range @ 20km [-]

0.06


Variance slope @ 1 km

2.64267481367e-05

Variance slope @ 2 km

3.6007907262e-05

Variance slope @ 5 km

3.40804056776e-05

Variance slope @ 10 km

2.26744560754e-05

Variance slope @ 20 km

1.12513754823e-05


NDVI (min. NDVI composite)I


Roman et al. (2009) index


St

5.54459509309

Rcv

-0.0321323074127

Rse

0.0

Rst

-0.174327563759

Rsv

0.33460759176


NDVI range @ 1km [-]

0.02

NDVI range @ 2km [-]

0.04

NDVI range @ 5km [-]

0.04

NDVI range @ 10km [-]

0.03

NDVI range @ 20km [-]

0.03


NDVI slope @ 1 km

8.62040743625e-06

NDVI slope @ 2 km

1.23419068221e-05

NDVI slope @ 5 km

1.18280071931e-05

NDVI slope @ 10 km

8.33394394752e-06

NDVI slope @ 20 km

4.07424511356e-06


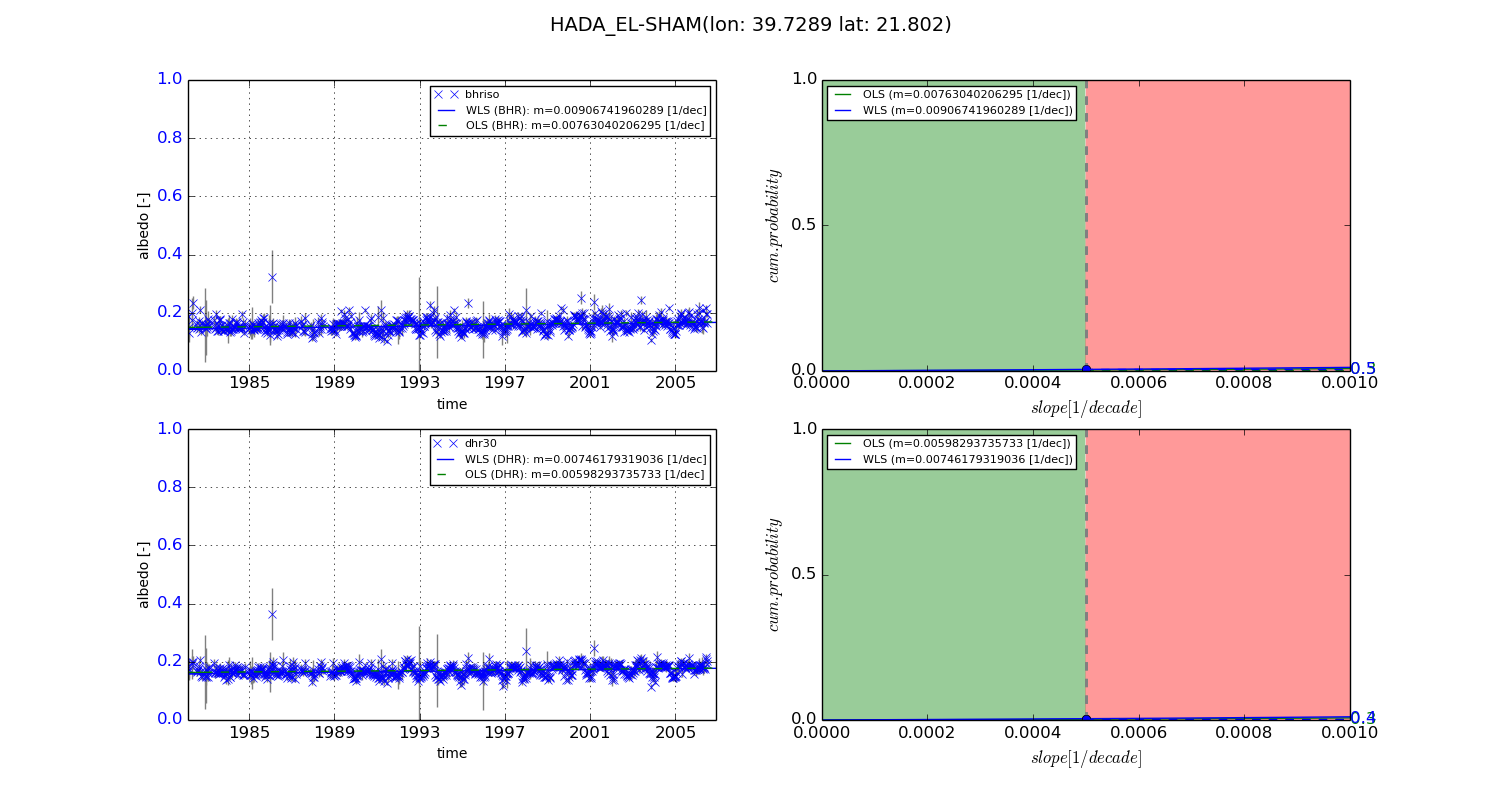
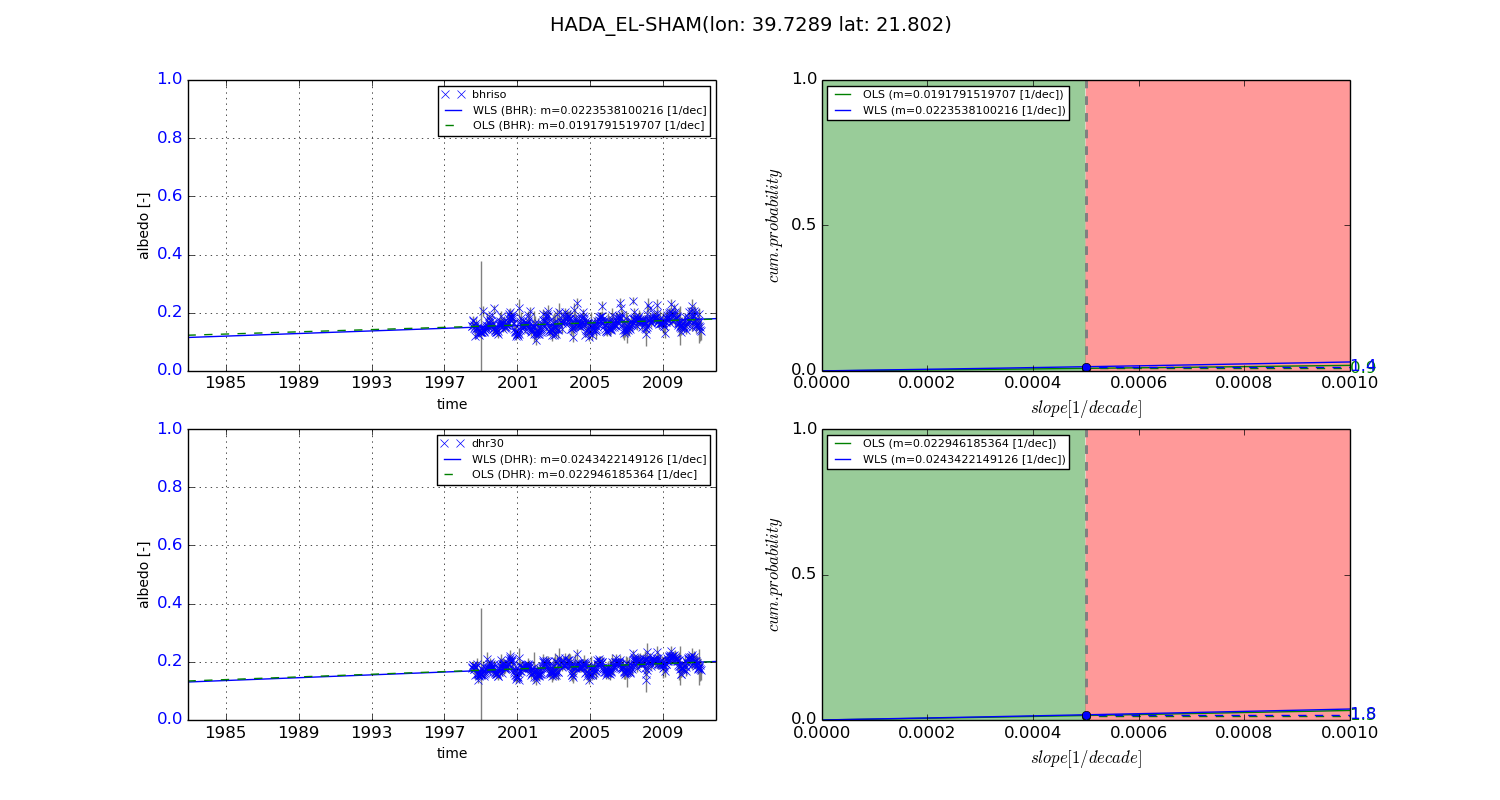
Temporal stability analysis

+000 deg (BHR)


BHR statistics

Temporal stability [1/decade]:


abs

rel


Weighted least square:

0.00906741960289


Ordinary least square:

0.00763040206295


Probabilities that GCOS criteria is met:

Weighted least square:

0.5 %

Ordinary least square:

0.3 %


DHR statistics

Temporal stability [1/decade]:


abs

rel


Weighted least square:

0.00746179319036


Ordinary least square:

0.00598293735733


Probabilities that GCOS criteria is met:

Weighted least square:

0.4 %

Ordinary least square:

0.3 %


+057/+063 deg (BHR)


BHR statistics

Temporal stability [1/decade]:


abs

rel


Weighted least square:

0.0223538100216


Ordinary least square:

0.0191791519707


Probabilities that GCOS criteria is met:

Weighted least square:

1.4 %

Ordinary least square:

0.9 %


DHR statistics

Temporal stability [1/decade]:


abs

rel


Weighted least square:

0.0243422149126


Ordinary least square:

0.022946185364


Probabilities that GCOS criteria is met:

Weighted least square:

1.8 %

Ordinary least square:

1.5 %


Temporal anomaly analyis

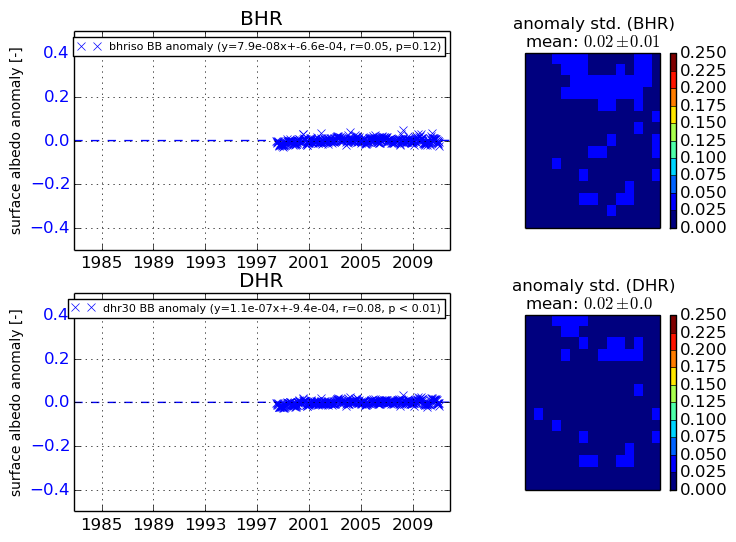
The variance of the temporal anomalies provides an additional measure about the stability of the signal AFTER removal of the mean seasonal cylce.
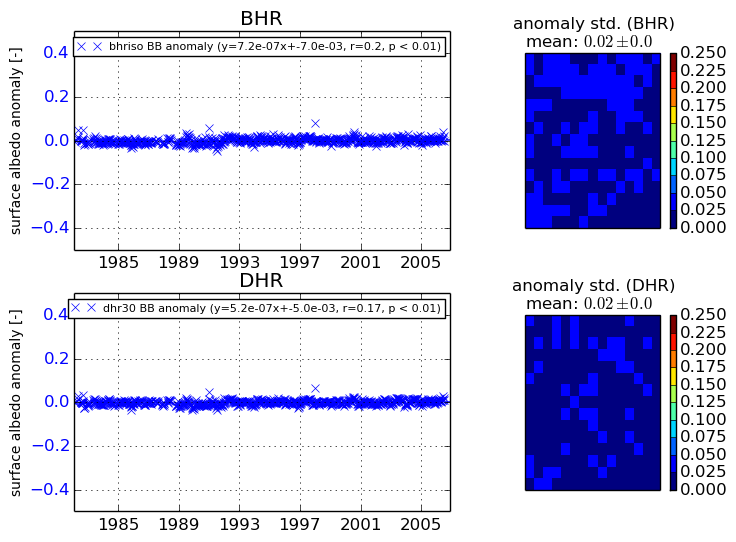
+000 deg


+057/+063 deg