HAMBURG


Location

lon / lat [deg]: 9.9733 / 53.5683

Source network: AERONET


Geostationary surface albedo (GSA) data


“+000”


“+057/+063”


Landcover information (based on ESA CCI landcover data)


Landcover fractions @ 2km distance


Landcover fractions @ 20 km distance


Legend


Distance to open water bodies [km]:

1.8

Distance to urban areas [km]:

0.04


Radius: 1 km

Number of landcover classes:

1

Dominant landcover type:

190: urban areas

Fraction of dominant landcover type [%]:

100.0


Radius: 2 km

Number of landcover classes:

2

Dominant landcover type:

190: urban areas

Fraction of dominant landcover type [%]:

98.0


Radius: 5 km

Number of landcover classes:

2

Dominant landcover type:

190: urban areas

Fraction of dominant landcover type [%]:

92.0


Radius: 10 km

Number of landcover classes:

4

Dominant landcover type:

190: urban areas

Fraction of dominant landcover type [%]:

90.0


Radius: 20 km

Number of landcover classes:

8

Dominant landcover type:

190: urban areas

Fraction of dominant landcover type [%]:

57.0


Disturbances


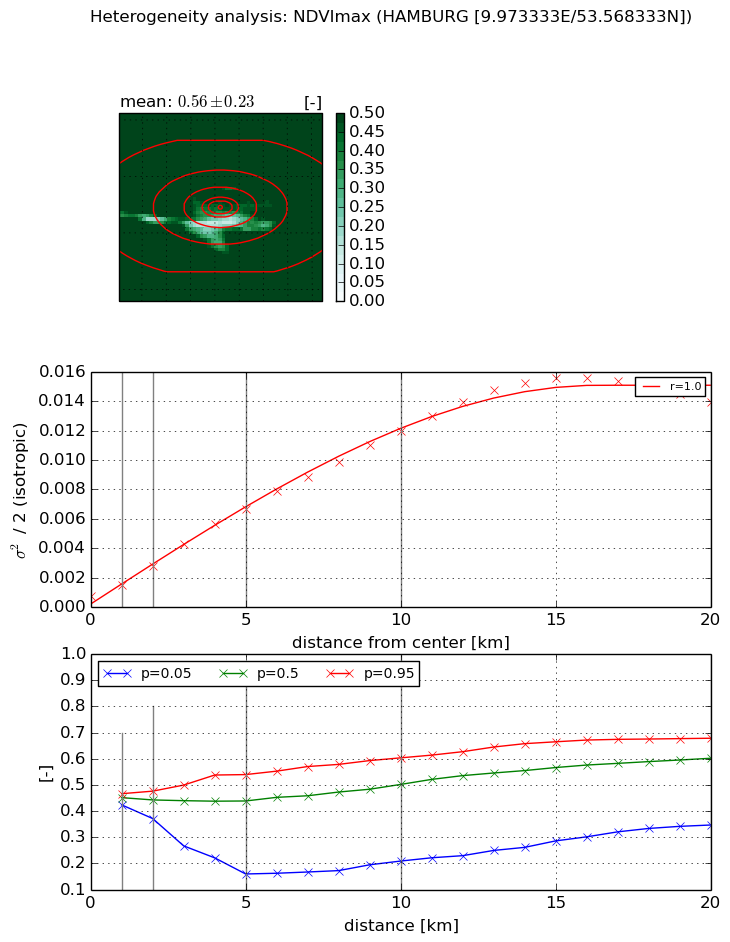
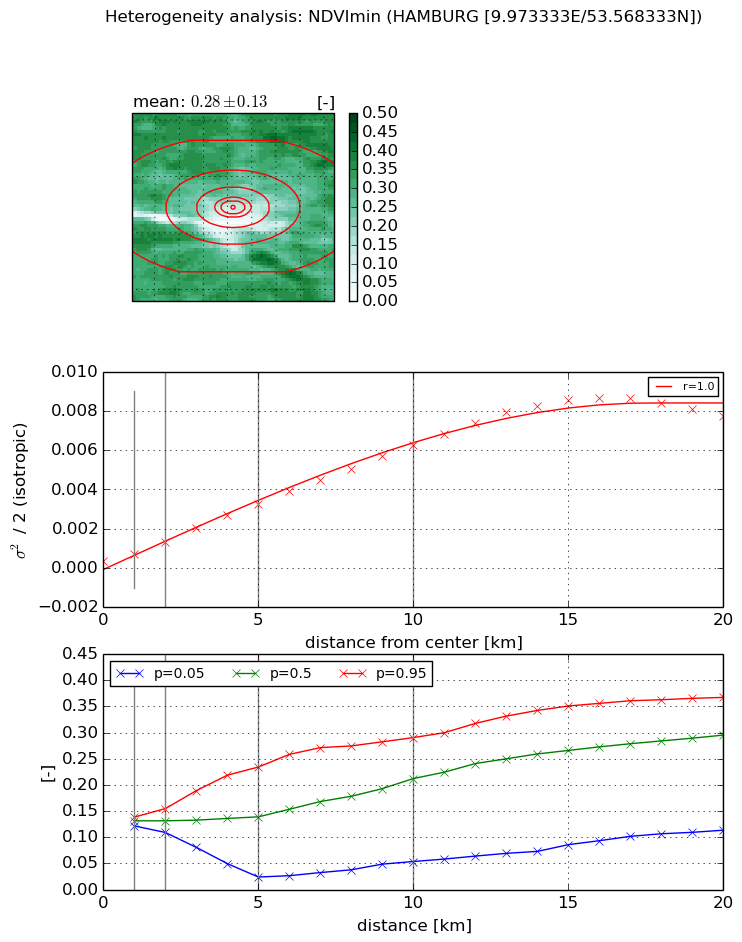
Heterogeneity analysis

The heterogeneity analysis provides information about the spatial and temporal heterogeneity of the site.

Topography


Roman et al. (2009) index


St

0.00652820338976

Rcv

0.55986909397

Rse

0.0

Rst

-1.42213685974e-06

Rsv

458.984635206


Height range @ 1km [m]

12

Height range @ 2km [m]

15

Height range @ 5km [m]

31

Height range @ 10km [m]

-999

Height range @ 20km [m]

-999


Variance slope @ 1 km

29

Variance slope @ 2 km

24

Variance slope @ 5 km

17

Variance slope @ 10 km

-999

Variance slope @ 20 km

-999


NDVI (max. NDVI composite)


Roman et al. (2009) index


St

1.25427568629e-07

Rcv

0.739638821543

Rse

0.0

Rst

0.0989974013823

Rsv

23918185.8312


NDVI range @ 1km [-]

0.04

NDVI range @ 2km [-]

0.1

NDVI range @ 5km [-]

0.38

NDVI range @ 10km [-]

0.39

NDVI range @ 20km [-]

0.33


Variance slope @ 1 km

0.000791737686005

Variance slope @ 2 km

0.00104420528135

Variance slope @ 5 km

0.00124104159698

Variance slope @ 10 km

0.00115296726347

Variance slope @ 20 km

0.000760200884789


NDVI (min. NDVI composite)I


Roman et al. (2009) index


St

0.136411886331

Rcv

0.837165353207

Rse

0.0

Rst

4.91688194233e-08

Rsv

21.1550530229


NDVI range @ 1km [-]

0.02

NDVI range @ 2km [-]

0.05

NDVI range @ 5km [-]

0.21

NDVI range @ 10km [-]

0.24

NDVI range @ 20km [-]

0.25


NDVI slope @ 1 km

0.000364657990605

NDVI slope @ 2 km

0.000486713171742

NDVI slope @ 5 km

0.000610402303452

NDVI slope @ 10 km

0.000606407840742

NDVI slope @ 20 km

0.000440400213037


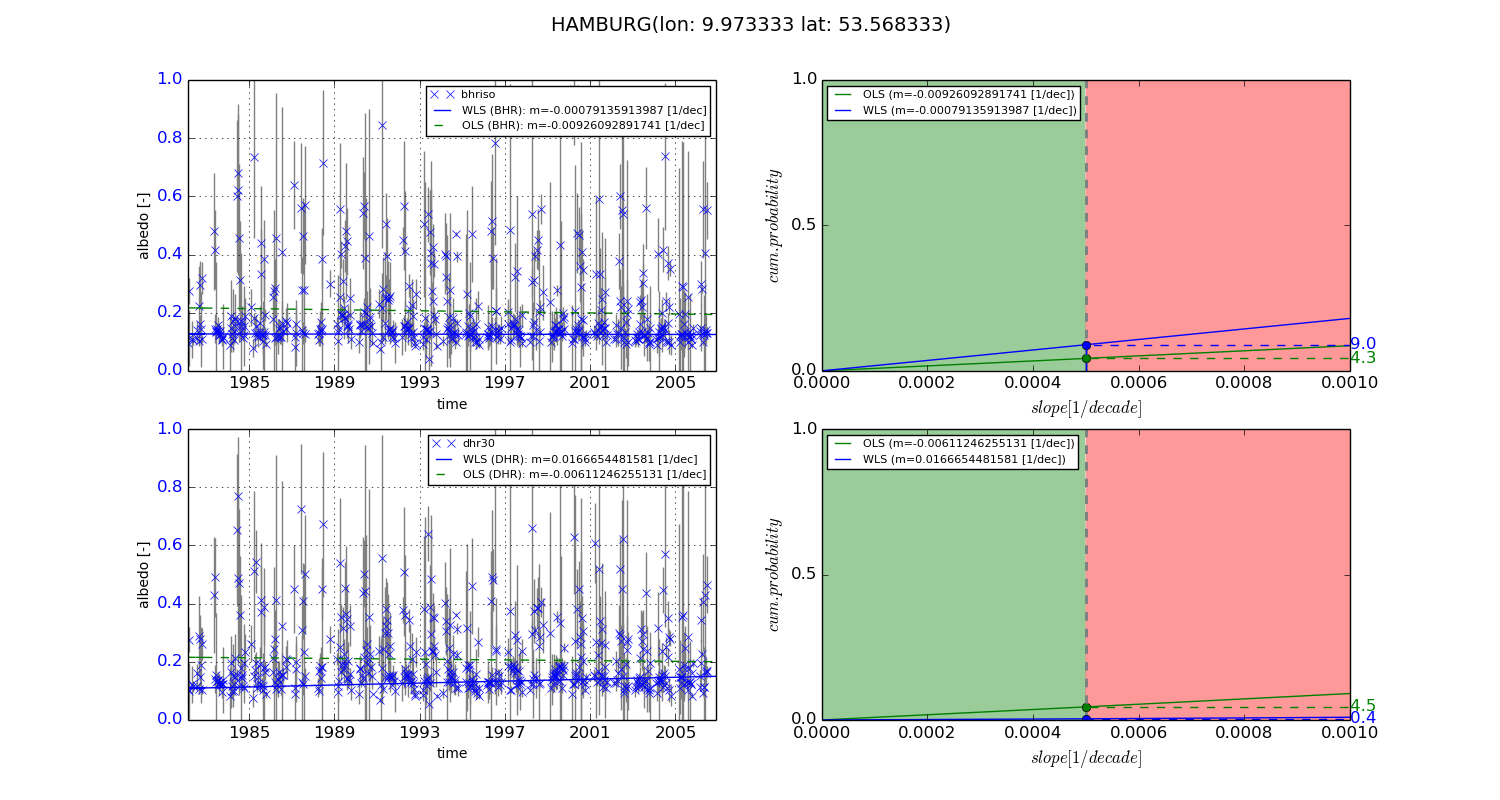
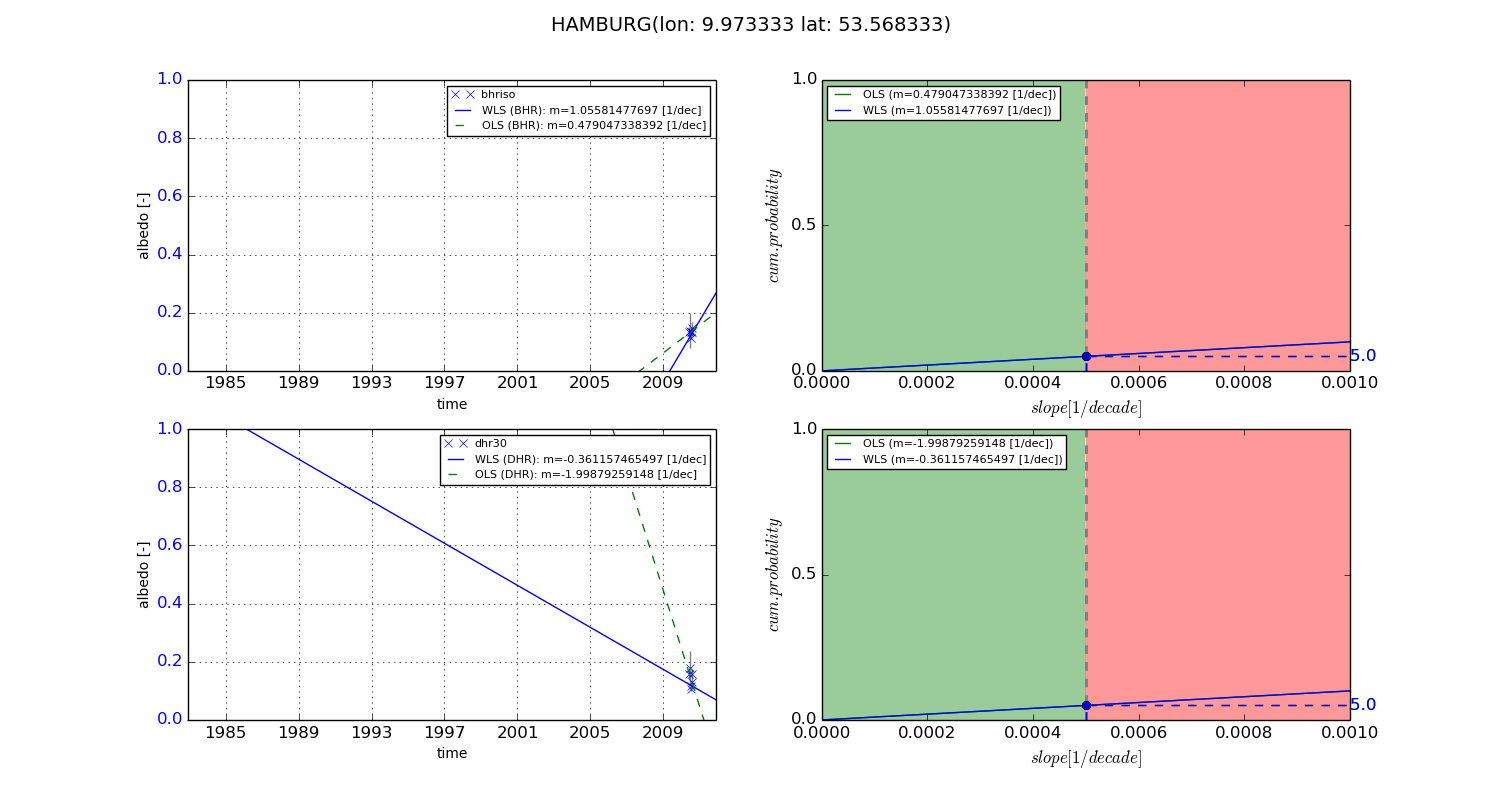
Temporal stability analysis

+000 deg (BHR)


BHR statistics

Temporal stability [1/decade]:


abs

rel


Weighted least square:

-0.00079135913987


Ordinary least square:

-0.00926092891741


Probabilities that GCOS criteria is met:

Weighted least square:

9.0 %

Ordinary least square:

4.3 %


DHR statistics

Temporal stability [1/decade]:


abs

rel


Weighted least square:

0.0166654481581


Ordinary least square:

-0.00611246255131


Probabilities that GCOS criteria is met:

Weighted least square:

0.4 %

Ordinary least square:

4.5 %


+057/+063 deg (BHR)


BHR statistics

Temporal stability [1/decade]:


abs

rel


Weighted least square:

1.05581477697


Ordinary least square:

0.479047338392


Probabilities that GCOS criteria is met:

Weighted least square:

5.0 %

Ordinary least square:

5.0 %


DHR statistics

Temporal stability [1/decade]:


abs

rel


Weighted least square:

-0.361157465497


Ordinary least square:

-1.99879259148


Probabilities that GCOS criteria is met:

Weighted least square:

5.0 %

Ordinary least square:

5.0 %


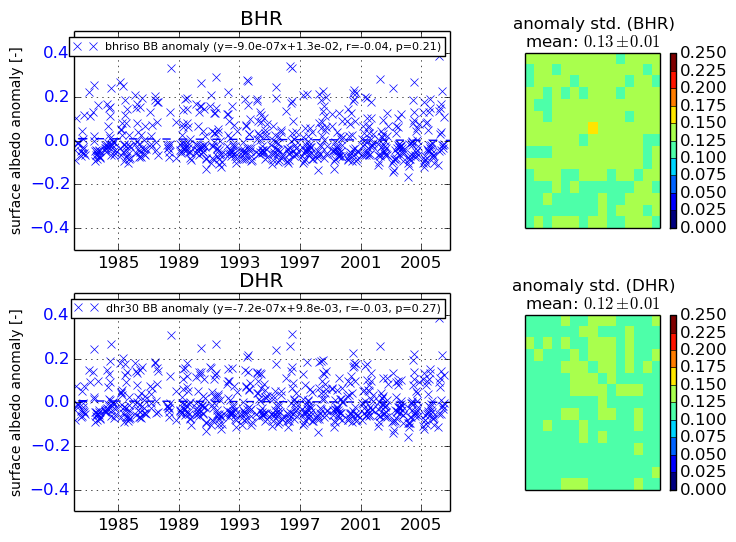
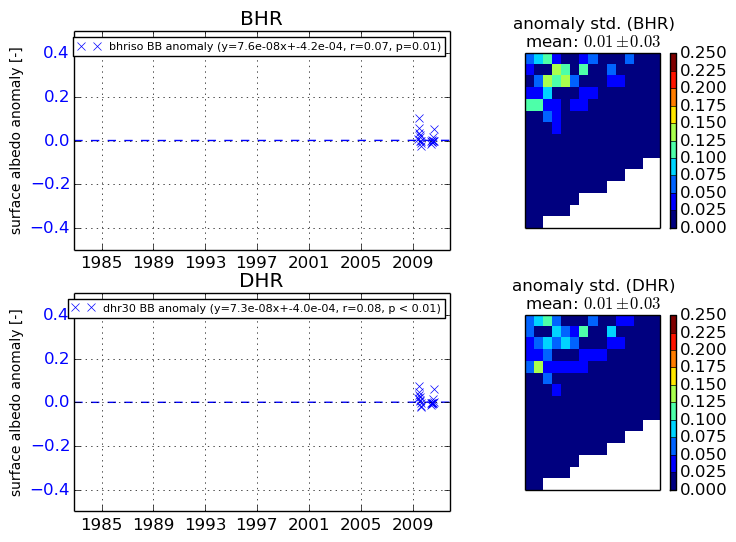
Temporal anomaly analyis

The variance of the temporal anomalies provides an additional measure about the stability of the signal AFTER removal of the mean seasonal cylce.
+000 deg


+057/+063 deg