HAMIM


Location

lon / lat [deg]: 54.3 / 22.9667

Source network: AERONET


Geostationary surface albedo (GSA) data


“+000”


“+057/+063”


Landcover information (based on ESA CCI landcover data)


Landcover fractions @ 2km distance


Landcover fractions @ 20 km distance


Legend


Distance to open water bodies [km]:

none in region

Distance to urban areas [km]:

7.19


Radius: 1 km

Number of landcover classes:

2

Dominant landcover type:

200: bare areas

Fraction of dominant landcover type [%]:

94.0


Radius: 2 km

Number of landcover classes:

2

Dominant landcover type:

200: bare areas

Fraction of dominant landcover type [%]:

89.0


Radius: 5 km

Number of landcover classes:

2

Dominant landcover type:

200: bare areas

Fraction of dominant landcover type [%]:

97.0


Radius: 10 km

Number of landcover classes:

2

Dominant landcover type:

200: bare areas

Fraction of dominant landcover type [%]:

98.0


Radius: 20 km

Number of landcover classes:

1

Dominant landcover type:

200: bare areas

Fraction of dominant landcover type [%]:

99.0


Disturbances


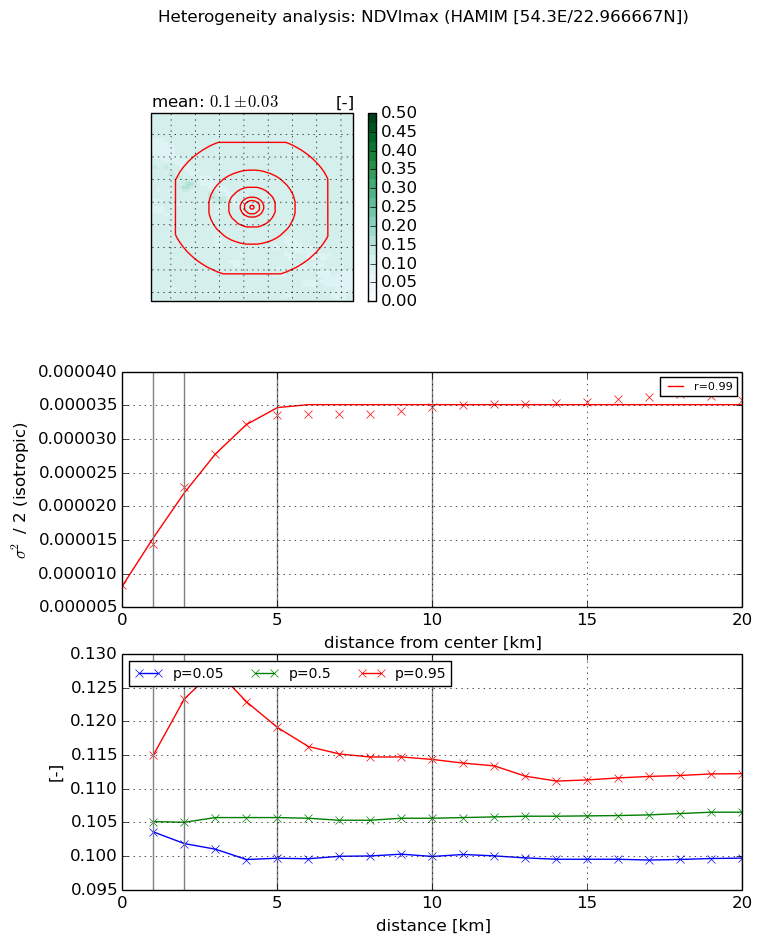
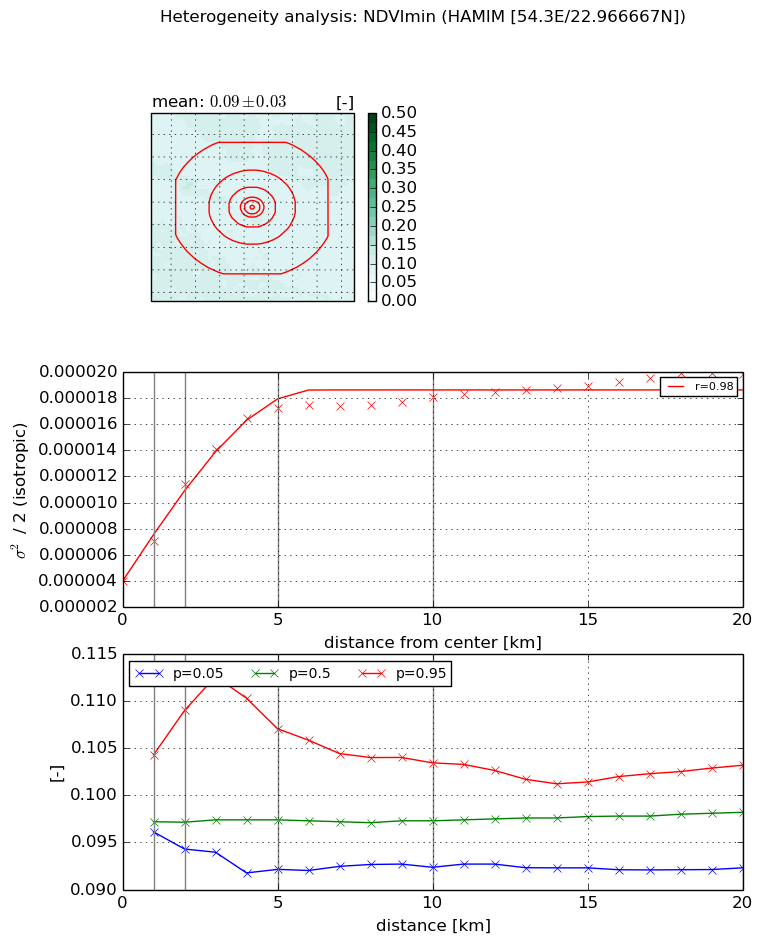
Heterogeneity analysis

The heterogeneity analysis provides information about the spatial and temporal heterogeneity of the site.

Topography


Roman et al. (2009) index


St

9.22960635711

Rcv

0.114917877384

Rse

0.0

Rst

0.0522067907157

Rsv

-0.157916279902


Height range @ 1km [m]

27

Height range @ 2km [m]

41

Height range @ 5km [m]

50

Height range @ 10km [m]

-999

Height range @ 20km [m]

-999


Variance slope @ 1 km

216

Variance slope @ 2 km

98

Variance slope @ 5 km

19

Variance slope @ 10 km

-999

Variance slope @ 20 km

-999


NDVI (max. NDVI composite)


Roman et al. (2009) index


St

7.38282696854

Rcv

-0.222321995924

Rse

0.0

Rst

0.109163340935

Rsv

-0.0748630731447


NDVI range @ 1km [-]

0.01

NDVI range @ 2km [-]

0.02

NDVI range @ 5km [-]

0.02

NDVI range @ 10km [-]

0.01

NDVI range @ 20km [-]

0.01


Variance slope @ 1 km

6.1056139486e-06

Variance slope @ 2 km

7.26252737397e-06

Variance slope @ 5 km

5.27327796859e-06

Variance slope @ 10 km

2.33277968944e-06

Variance slope @ 20 km

8.93816233984e-07


NDVI (min. NDVI composite)I


Roman et al. (2009) index


St

6.40287530897

Rcv

-0.197227527596

Rse

0.0

Rst

0.0949832669208

Rsv

-0.176328706135


NDVI range @ 1km [-]

0.01

NDVI range @ 2km [-]

0.01

NDVI range @ 5km [-]

0.01

NDVI range @ 10km [-]

0.01

NDVI range @ 20km [-]

0.01


NDVI slope @ 1 km

3.05202898796e-06

NDVI slope @ 2 km

3.71806750761e-06

NDVI slope @ 5 km

2.77377989242e-06

NDVI slope @ 10 km

1.25762117479e-06

NDVI slope @ 20 km

5.3964779782e-07


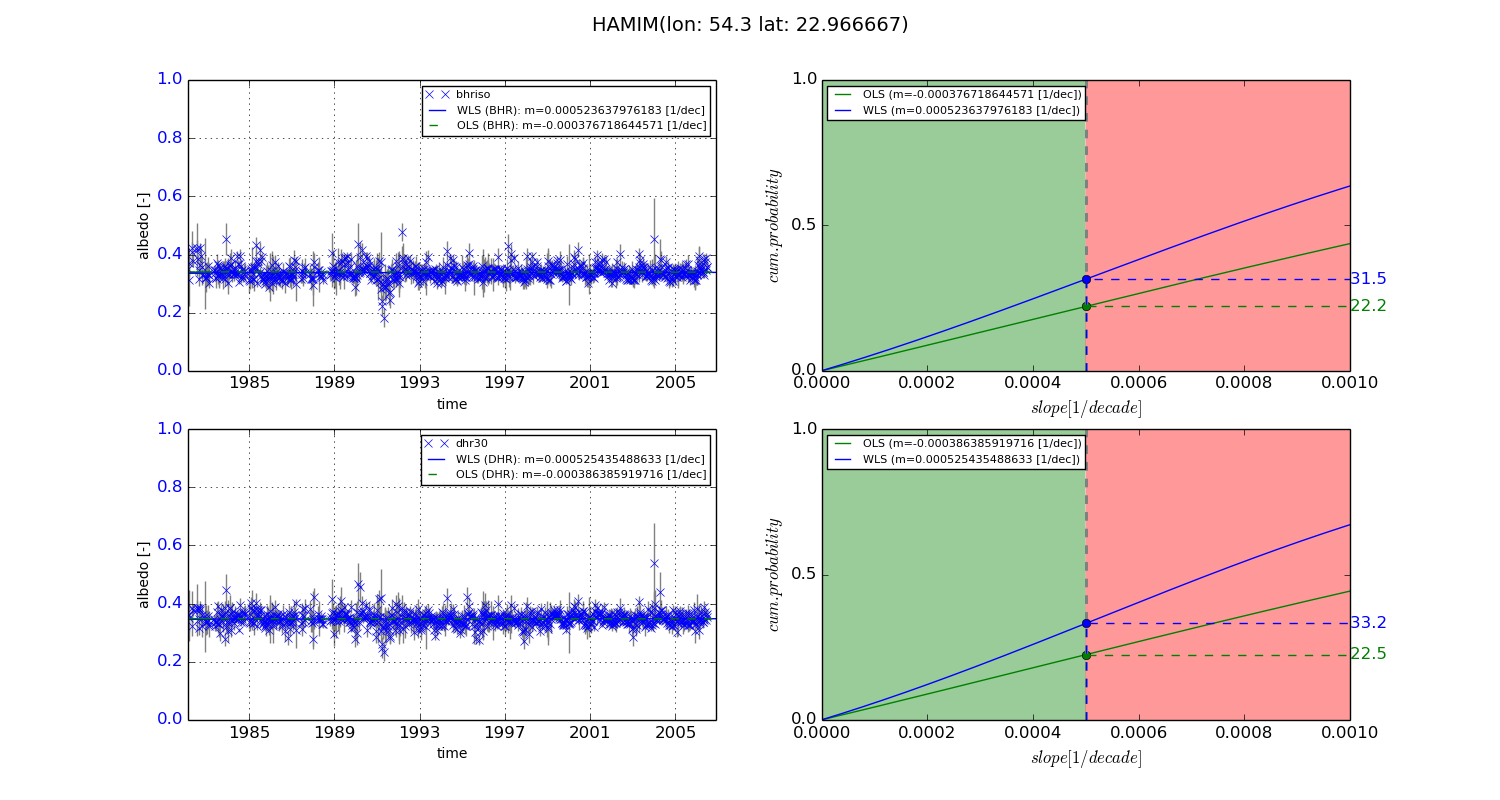
Temporal stability analysis

+000 deg (BHR)


BHR statistics

Temporal stability [1/decade]:


abs

rel


Weighted least square:

0.000523637976183


Ordinary least square:

-0.000376718644571


Probabilities that GCOS criteria is met:

Weighted least square:

31.5 %

Ordinary least square:

22.2 %


DHR statistics

Temporal stability [1/decade]:


abs

rel


Weighted least square:

0.000525435488633


Ordinary least square:

-0.000386385919716


Probabilities that GCOS criteria is met:

Weighted least square:

33.2 %

Ordinary least square:

22.5 %


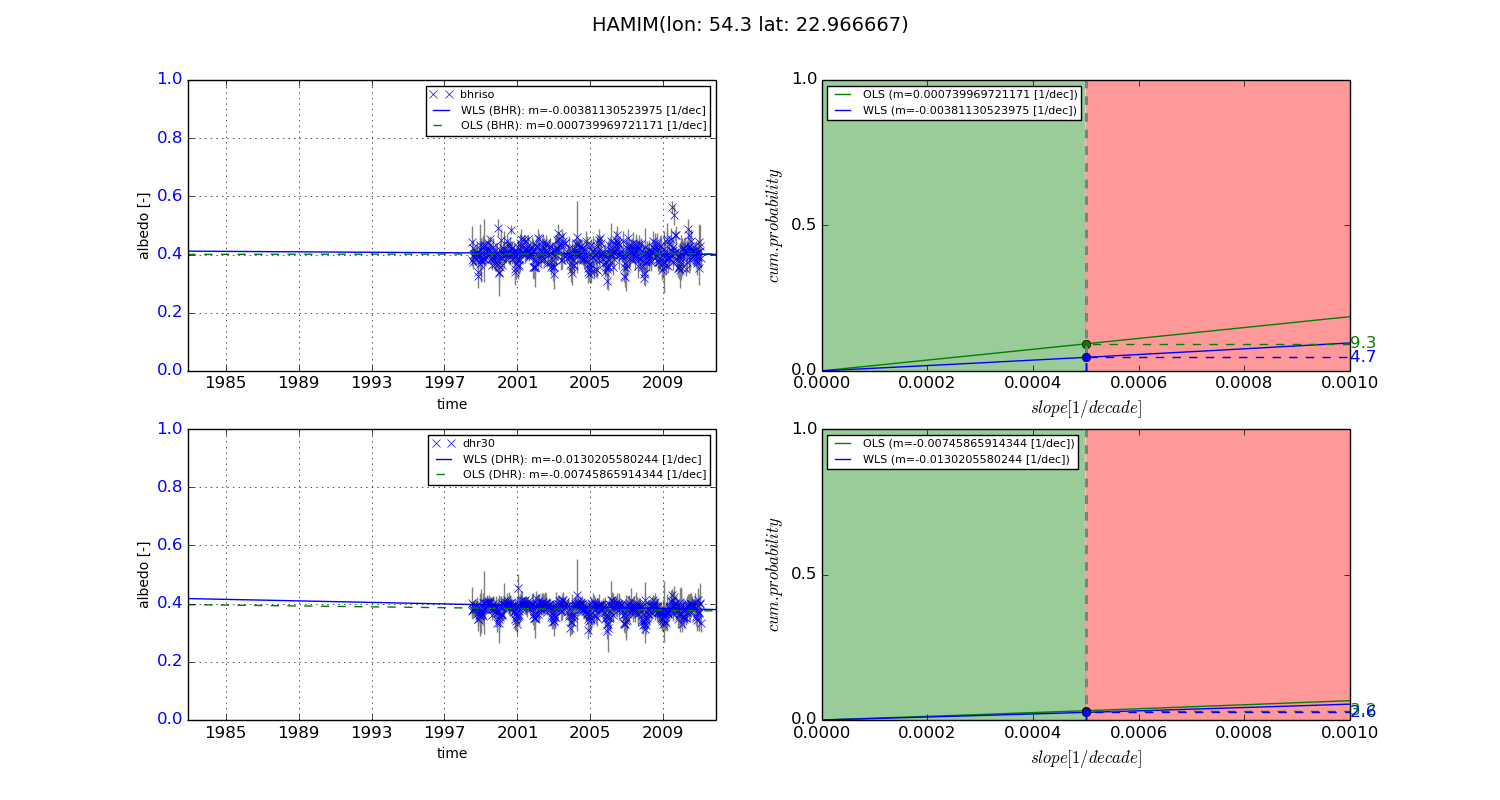
+057/+063 deg (BHR)


BHR statistics

Temporal stability [1/decade]:


abs

rel


Weighted least square:

-0.00381130523975


Ordinary least square:

0.000739969721171


Probabilities that GCOS criteria is met:

Weighted least square:

4.7 %

Ordinary least square:

9.3 %


DHR statistics

Temporal stability [1/decade]:


abs

rel


Weighted least square:

-0.0130205580244


Ordinary least square:

-0.00745865914344


Probabilities that GCOS criteria is met:

Weighted least square:

2.6 %

Ordinary least square:

3.2 %


Temporal anomaly analyis

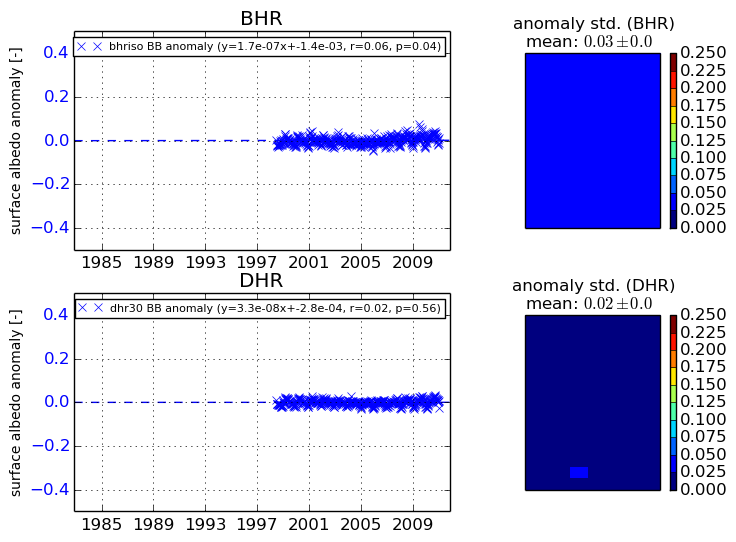
The variance of the temporal anomalies provides an additional measure about the stability of the signal AFTER removal of the mean seasonal cylce.
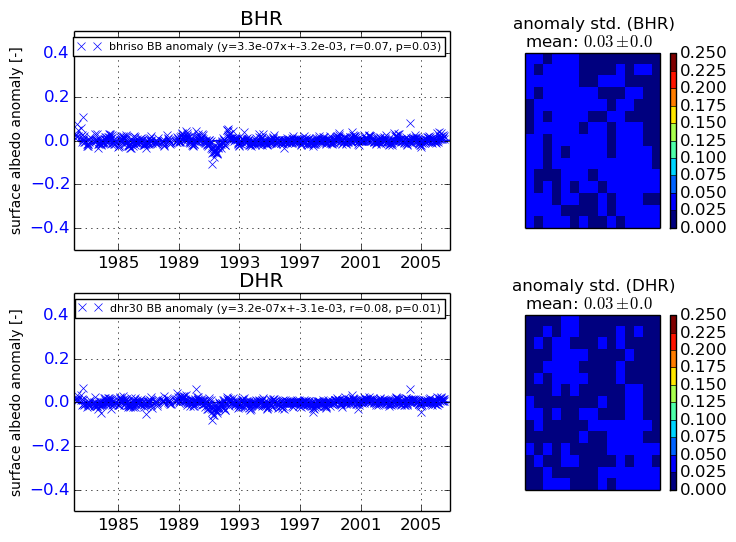
+000 deg


+057/+063 deg