HAND_KANPUR_NORTH


Location

lon / lat [deg]: 80.3121 / 26.4986

Source network: AERONET


Geostationary surface albedo (GSA) data


“+000”


“+057/+063”


Landcover information (based on ESA CCI landcover data)


Landcover fractions @ 2km distance


Landcover fractions @ 20 km distance


Legend


Distance to open water bodies [km]:

4.01

Distance to urban areas [km]:

0.04


Radius: 1 km

Number of landcover classes:

1

Dominant landcover type:

190: urban areas

Fraction of dominant landcover type [%]:

100.0


Radius: 2 km

Number of landcover classes:

1

Dominant landcover type:

190: urban areas

Fraction of dominant landcover type [%]:

100.0


Radius: 5 km

Number of landcover classes:

3

Dominant landcover type:

190: urban areas

Fraction of dominant landcover type [%]:

90.0


Radius: 10 km

Number of landcover classes:

6

Dominant landcover type:

190: urban areas

Fraction of dominant landcover type [%]:

58.0


Radius: 20 km

Number of landcover classes:

3

Dominant landcover type:

20: cropland, irrigated or post-flooded

Fraction of dominant landcover type [%]:

68.0


Disturbances


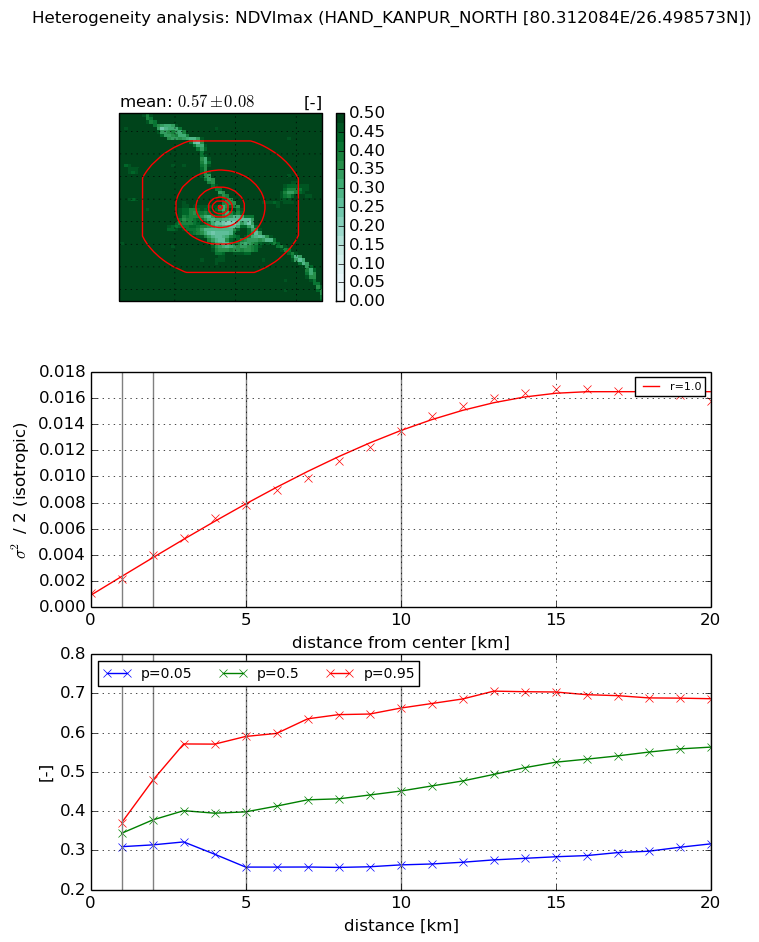
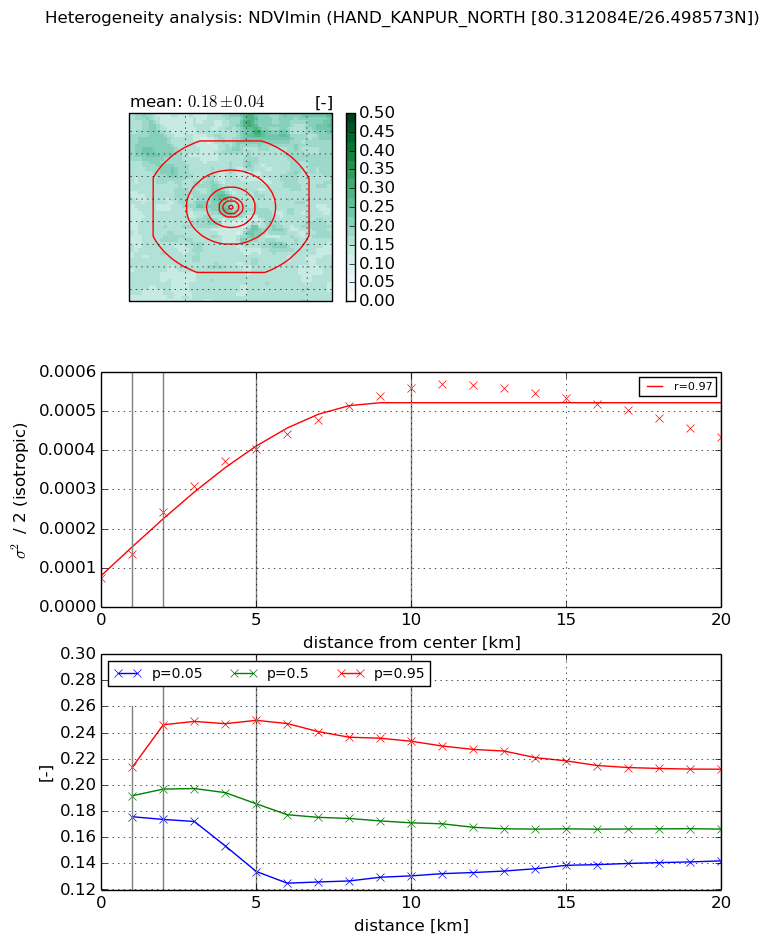
Heterogeneity analysis

The heterogeneity analysis provides information about the spatial and temporal heterogeneity of the site.

Topography


Roman et al. (2009) index


St

2.65011987422

Rcv

0.0622964140519

Rse

0.0

Rst

-0.0701762050013

Rsv

-0.999551644899


Height range @ 1km [m]

18

Height range @ 2km [m]

18

Height range @ 5km [m]

19

Height range @ 10km [m]

-999

Height range @ 20km [m]

-999


Variance slope @ 1 km

7

Variance slope @ 2 km

8

Variance slope @ 5 km

10

Variance slope @ 10 km

-999

Variance slope @ 20 km

-999


NDVI (max. NDVI composite)


Roman et al. (2009) index


St

6.5665803298e-07

Rcv

0.412962808083

Rse

0.0

Rst

0.186486024747

Rsv

4568587.38597


NDVI range @ 1km [-]

0.06

NDVI range @ 2km [-]

0.16

NDVI range @ 5km [-]

0.33

NDVI range @ 10km [-]

0.4

NDVI range @ 20km [-]

0.37


Variance slope @ 1 km

0.0010068110376

Variance slope @ 2 km

0.00144335202887

Variance slope @ 5 km

0.00139659471518

Variance slope @ 10 km

0.00122811490999

Variance slope @ 20 km

0.00079780089472


NDVI (min. NDVI composite)I


Roman et al. (2009) index


St

2.25616184442

Rcv

0.544645538569

Rse

0.0

Rst

-0.150695900993

Rsv

0.634350402987


NDVI range @ 1km [-]

0.04

NDVI range @ 2km [-]

0.07

NDVI range @ 5km [-]

0.12

NDVI range @ 10km [-]

0.1

NDVI range @ 20km [-]

0.07


NDVI slope @ 1 km

6.2781159787e-05

NDVI slope @ 2 km

8.51179218279e-05

NDVI slope @ 5 km

6.94362017415e-05

NDVI slope @ 10 km

4.77804936271e-05

NDVI slope @ 20 km

1.56693361539e-05


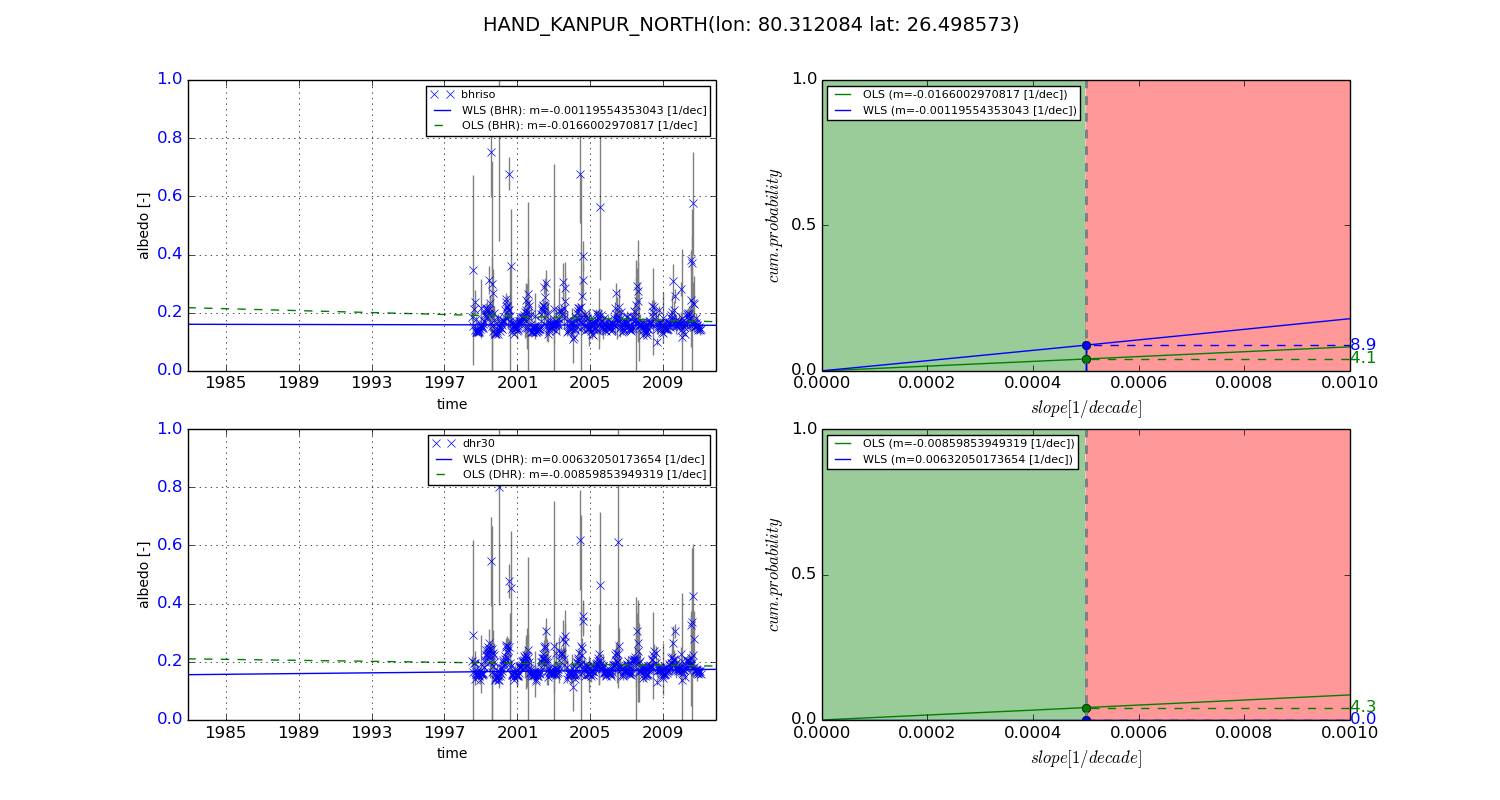
Temporal stability analysis

+000 deg (BHR)


BHR statistics

Temporal stability [1/decade]:


abs

rel


Weighted least square:

None


Ordinary least square:

None


Probabilities that GCOS criteria is met:

Weighted least square:

None %

Ordinary least square:

None %


DHR statistics

Temporal stability [1/decade]:


abs

rel


Weighted least square:

None


Ordinary least square:

None


Probabilities that GCOS criteria is met:

Weighted least square:

None %

Ordinary least square:

None %


+057/+063 deg (BHR)


BHR statistics

Temporal stability [1/decade]:


abs

rel


Weighted least square:

-0.00119554353043


Ordinary least square:

-0.0166002970817


Probabilities that GCOS criteria is met:

Weighted least square:

8.9 %

Ordinary least square:

4.1 %


DHR statistics

Temporal stability [1/decade]:


abs

rel


Weighted least square:

0.00632050173654


Ordinary least square:

-0.00859853949319


Probabilities that GCOS criteria is met:

Weighted least square:

0.0 %

Ordinary least square:

4.3 %


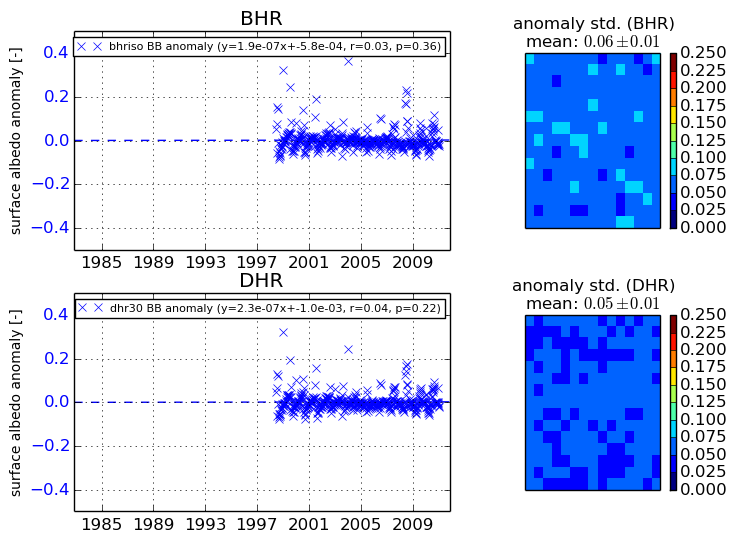
Temporal anomaly analyis

The variance of the temporal anomalies provides an additional measure about the stability of the signal AFTER removal of the mean seasonal cylce.

+000 deg


+057/+063 deg