HAND_KANPUR_RR


Location

lon / lat [deg]: 80.3506 / 26.4555

Source network: AERONET


Geostationary surface albedo (GSA) data


“+000”


“+057/+063”


Landcover information (based on ESA CCI landcover data)


Landcover fractions @ 2km distance


Landcover fractions @ 20 km distance


Legend


Distance to open water bodies [km]:

2.8

Distance to urban areas [km]:

0.16


Radius: 1 km

Number of landcover classes:

1

Dominant landcover type:

190: urban areas

Fraction of dominant landcover type [%]:

100.0


Radius: 2 km

Number of landcover classes:

1

Dominant landcover type:

190: urban areas

Fraction of dominant landcover type [%]:

100.0


Radius: 5 km

Number of landcover classes:

2

Dominant landcover type:

190: urban areas

Fraction of dominant landcover type [%]:

96.0


Radius: 10 km

Number of landcover classes:

4

Dominant landcover type:

190: urban areas

Fraction of dominant landcover type [%]:

65.0


Radius: 20 km

Number of landcover classes:

4

Dominant landcover type:

20: cropland, irrigated or post-flooded

Fraction of dominant landcover type [%]:

67.0


Disturbances


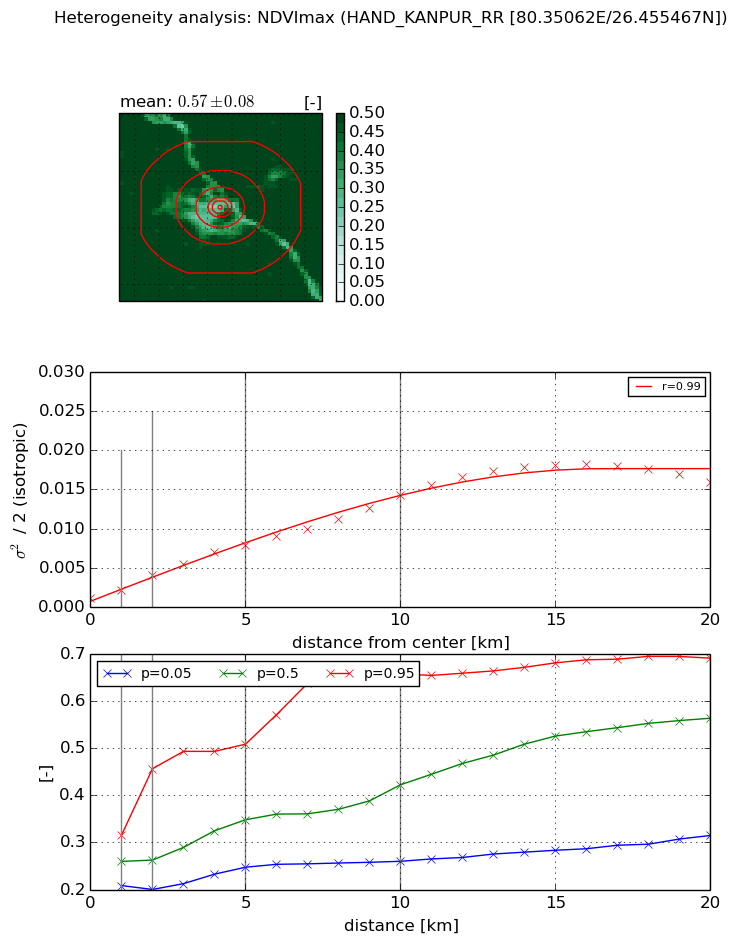
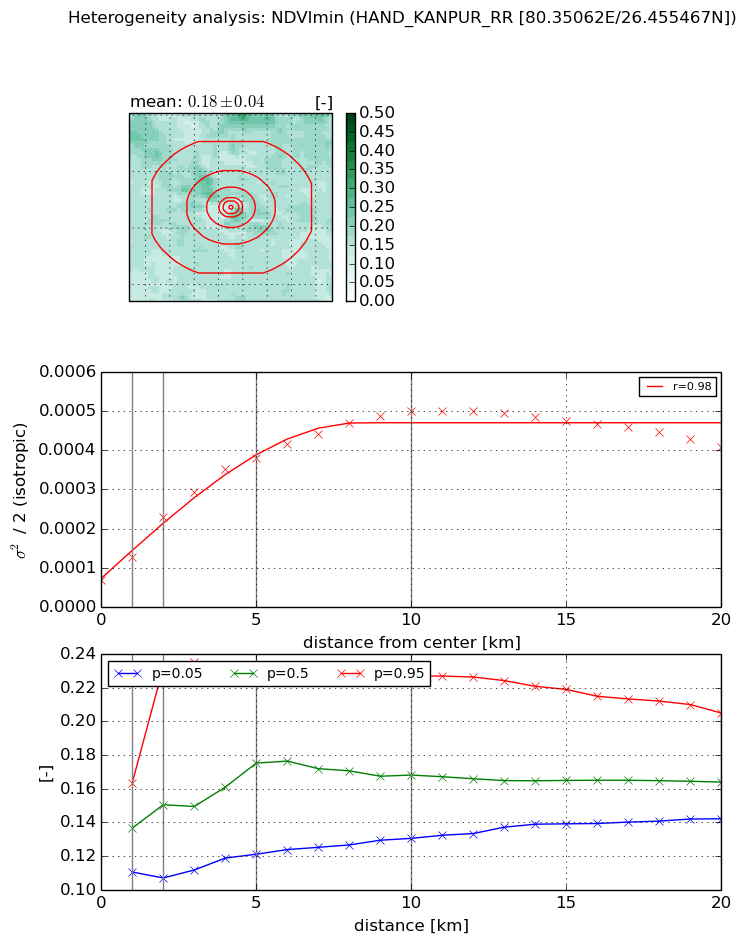
Heterogeneity analysis

The heterogeneity analysis provides information about the spatial and temporal heterogeneity of the site.

Topography


Roman et al. (2009) index


St

1.05644142725e-07

Rcv

0.614835113712

Rse

0.0

Rst

0.0334317284462

Rsv

28397219.7051


Height range @ 1km [m]

8

Height range @ 2km [m]

8

Height range @ 5km [m]

21

Height range @ 10km [m]

-999

Height range @ 20km [m]

-999


Variance slope @ 1 km

9

Variance slope @ 2 km

10

Variance slope @ 5 km

10

Variance slope @ 10 km

-999

Variance slope @ 20 km

-999


NDVI (max. NDVI composite)


Roman et al. (2009) index


St

8.32830236728

Rcv

-0.0593648686076

Rse

0.0

Rst

-0.104119334361

Rsv

0.196733266054


NDVI range @ 1km [-]

0.11

NDVI range @ 2km [-]

0.26

NDVI range @ 5km [-]

0.26

NDVI range @ 10km [-]

0.4

NDVI range @ 20km [-]

0.38


Variance slope @ 1 km

0.00106497461904

Variance slope @ 2 km

0.0014826304943

Variance slope @ 5 km

0.0014191019471

Variance slope @ 10 km

0.00127007893168

Variance slope @ 20 km

0.000864134964785


NDVI (min. NDVI composite)I


Roman et al. (2009) index


St

7.99748105034

Rcv

-0.195474549377

Rse

0.0

Rst

-0.0414381344693

Rsv

0.138205429109


NDVI range @ 1km [-]

0.05

NDVI range @ 2km [-]

0.13

NDVI range @ 5km [-]

0.11

NDVI range @ 10km [-]

0.1

NDVI range @ 20km [-]

0.06


NDVI slope @ 1 km

5.93632851409e-05

NDVI slope @ 2 km

8.03444475599e-05

NDVI slope @ 5 km

6.55298323625e-05

NDVI slope @ 10 km

4.25616106029e-05

NDVI slope @ 20 km

1.38490408605e-05


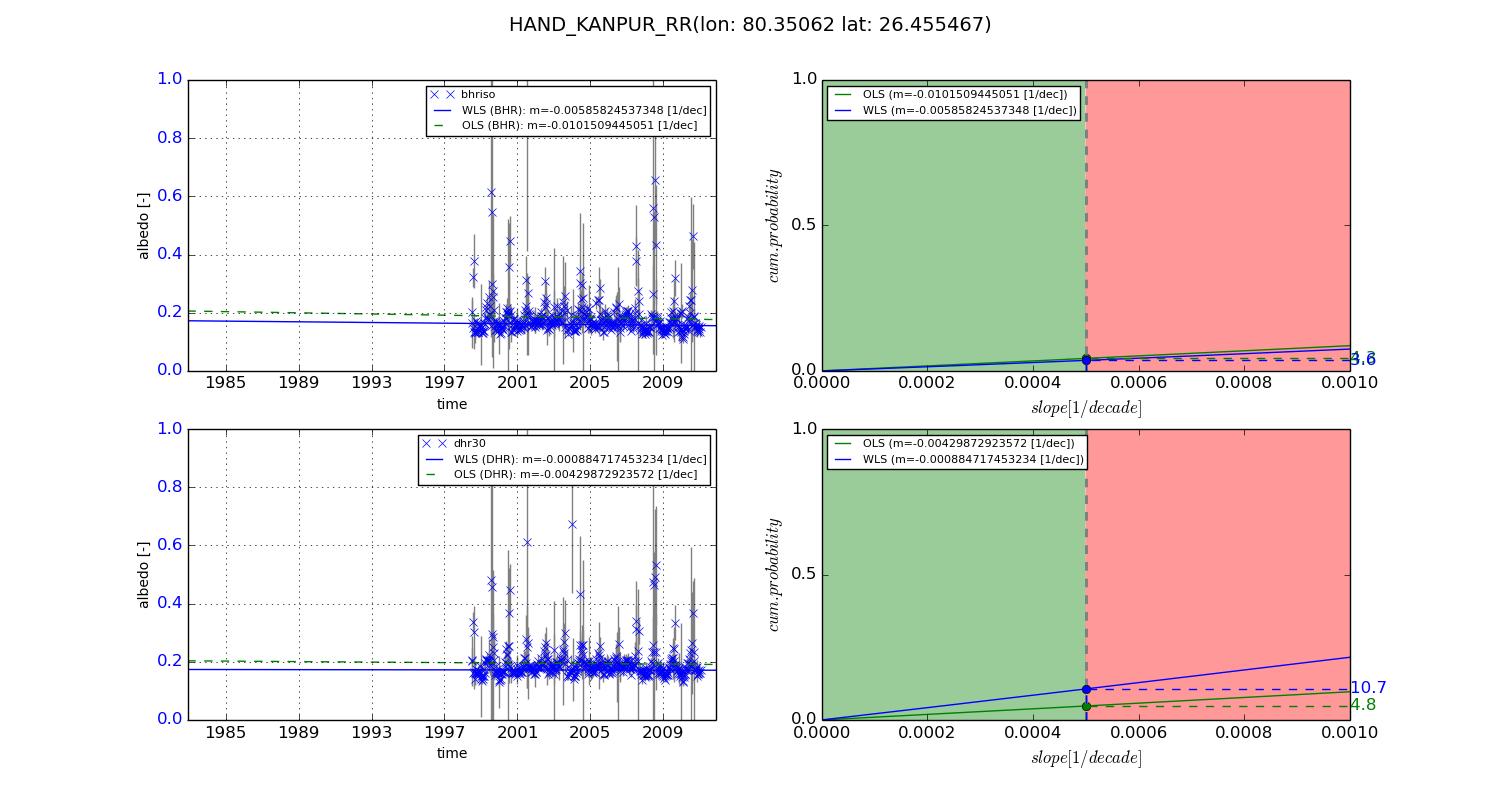
Temporal stability analysis

+000 deg (BHR)


BHR statistics

Temporal stability [1/decade]:


abs

rel


Weighted least square:

None


Ordinary least square:

None


Probabilities that GCOS criteria is met:

Weighted least square:

None %

Ordinary least square:

None %


DHR statistics

Temporal stability [1/decade]:


abs

rel


Weighted least square:

None


Ordinary least square:

None


Probabilities that GCOS criteria is met:

Weighted least square:

None %

Ordinary least square:

None %


+057/+063 deg (BHR)


BHR statistics

Temporal stability [1/decade]:


abs

rel


Weighted least square:

-0.00585824537348


Ordinary least square:

-0.0101509445051


Probabilities that GCOS criteria is met:

Weighted least square:

3.6 %

Ordinary least square:

4.3 %


DHR statistics

Temporal stability [1/decade]:


abs

rel


Weighted least square:

-0.000884717453234


Ordinary least square:

-0.00429872923572


Probabilities that GCOS criteria is met:

Weighted least square:

10.7 %

Ordinary least square:

4.8 %


Temporal anomaly analyis

The variance of the temporal anomalies provides an additional measure about the stability of the signal AFTER removal of the mean seasonal cylce.

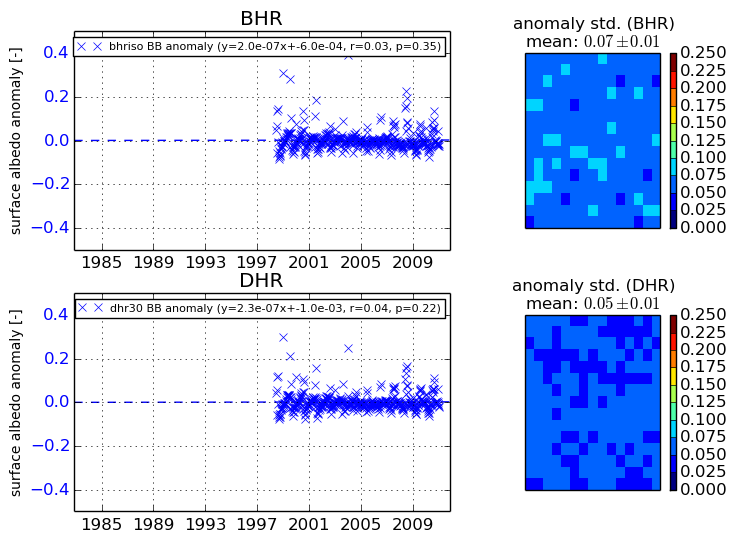
+000 deg


+057/+063 deg