HAND_KANPUR_SOUTH


Location

lon / lat [deg]: 80.3173 / 26.4107

Source network: AERONET


Geostationary surface albedo (GSA) data


“+000”


“+057/+063”


Landcover information (based on ESA CCI landcover data)


Landcover fractions @ 2km distance


Landcover fractions @ 20 km distance


Legend


Distance to open water bodies [km]:

0.47

Distance to urban areas [km]:

0.13


Radius: 1 km

Number of landcover classes:

3

Dominant landcover type:

190: urban areas

Fraction of dominant landcover type [%]:

72.0


Radius: 2 km

Number of landcover classes:

6

Dominant landcover type:

190: urban areas

Fraction of dominant landcover type [%]:

65.0


Radius: 5 km

Number of landcover classes:

5

Dominant landcover type:

190: urban areas

Fraction of dominant landcover type [%]:

56.0


Radius: 10 km

Number of landcover classes:

4

Dominant landcover type:

190: urban areas

Fraction of dominant landcover type [%]:

48.0


Radius: 20 km

Number of landcover classes:

3

Dominant landcover type:

20: cropland, irrigated or post-flooded

Fraction of dominant landcover type [%]:

70.0


Disturbances


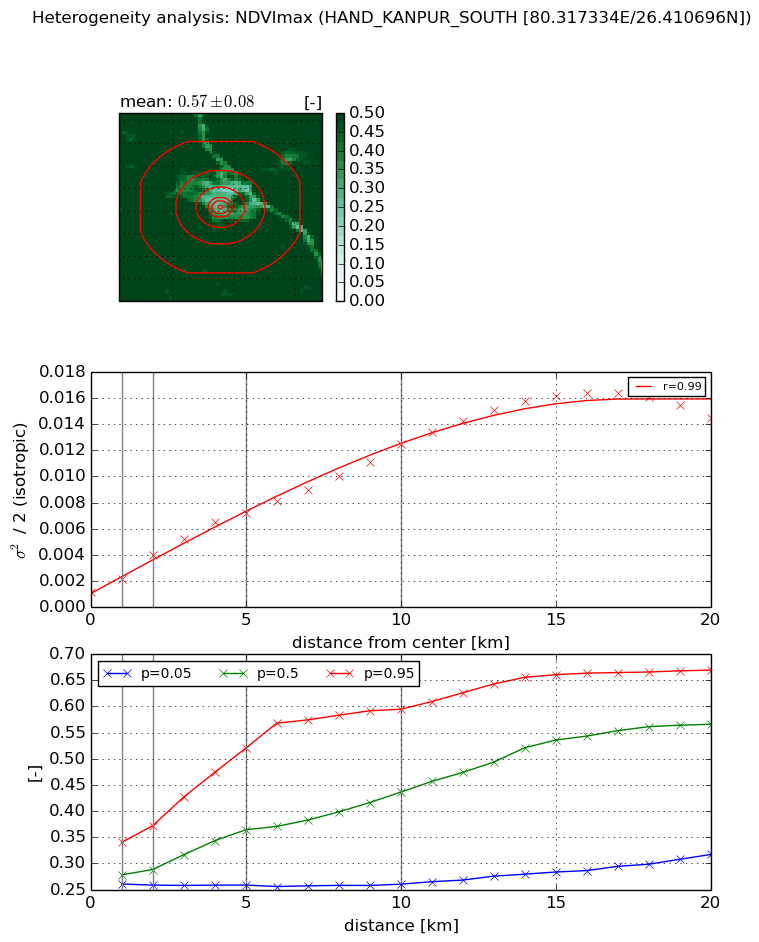
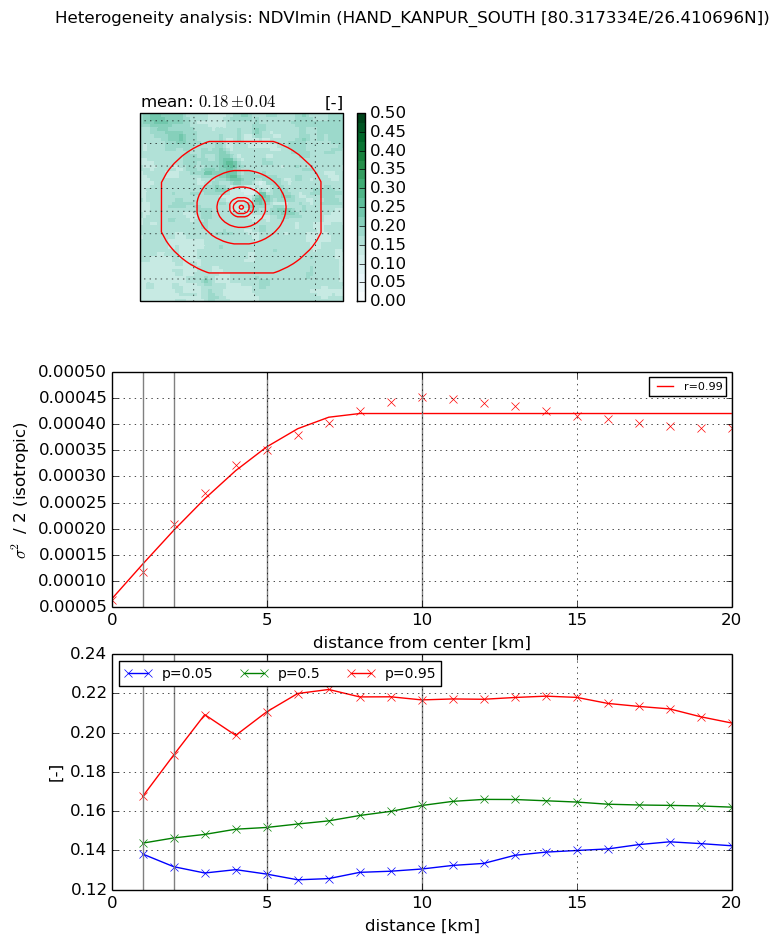
Heterogeneity analysis

The heterogeneity analysis provides information about the spatial and temporal heterogeneity of the site.

Topography


Roman et al. (2009) index


St

0.103082271323

Rcv

0.159605900911

Rse

0.0

Rst

-7.31654876086e-08

Rsv

28.9433616023


Height range @ 1km [m]

5

Height range @ 2km [m]

5

Height range @ 5km [m]

9

Height range @ 10km [m]

-999

Height range @ 20km [m]

-999


Variance slope @ 1 km

2

Variance slope @ 2 km

1

Variance slope @ 5 km

0

Variance slope @ 10 km

-999

Variance slope @ 20 km

-999


NDVI (max. NDVI composite)


Roman et al. (2009) index


St

1.805974587

Rcv

0.376409765259

Rse

0.0

Rst

-0.284743879452

Rsv

-0.999999298189


NDVI range @ 1km [-]

0.08

NDVI range @ 2km [-]

0.11

NDVI range @ 5km [-]

0.26

NDVI range @ 10km [-]

0.33

NDVI range @ 20km [-]

0.35


Variance slope @ 1 km

0.00101945634404

Variance slope @ 2 km

0.00139357546519

Variance slope @ 5 km

0.00127252763207

Variance slope @ 10 km

0.00108782200798

Variance slope @ 20 km

0.000769179349588


NDVI (min. NDVI composite)I


Roman et al. (2009) index


St

3.43610270165e-07

Rcv

-0.0178216390938

Rse

0.0

Rst

0.36552846606

Rsv

8730821.30763


NDVI range @ 1km [-]

0.03

NDVI range @ 2km [-]

0.06

NDVI range @ 5km [-]

0.08

NDVI range @ 10km [-]

0.09

NDVI range @ 20km [-]

0.06


NDVI slope @ 1 km

5.42576410282e-05

NDVI slope @ 2 km

7.30950344418e-05

NDVI slope @ 5 km

6.00322761559e-05

NDVI slope @ 10 km

3.82916872465e-05

NDVI slope @ 20 km

1.21709129925e-05


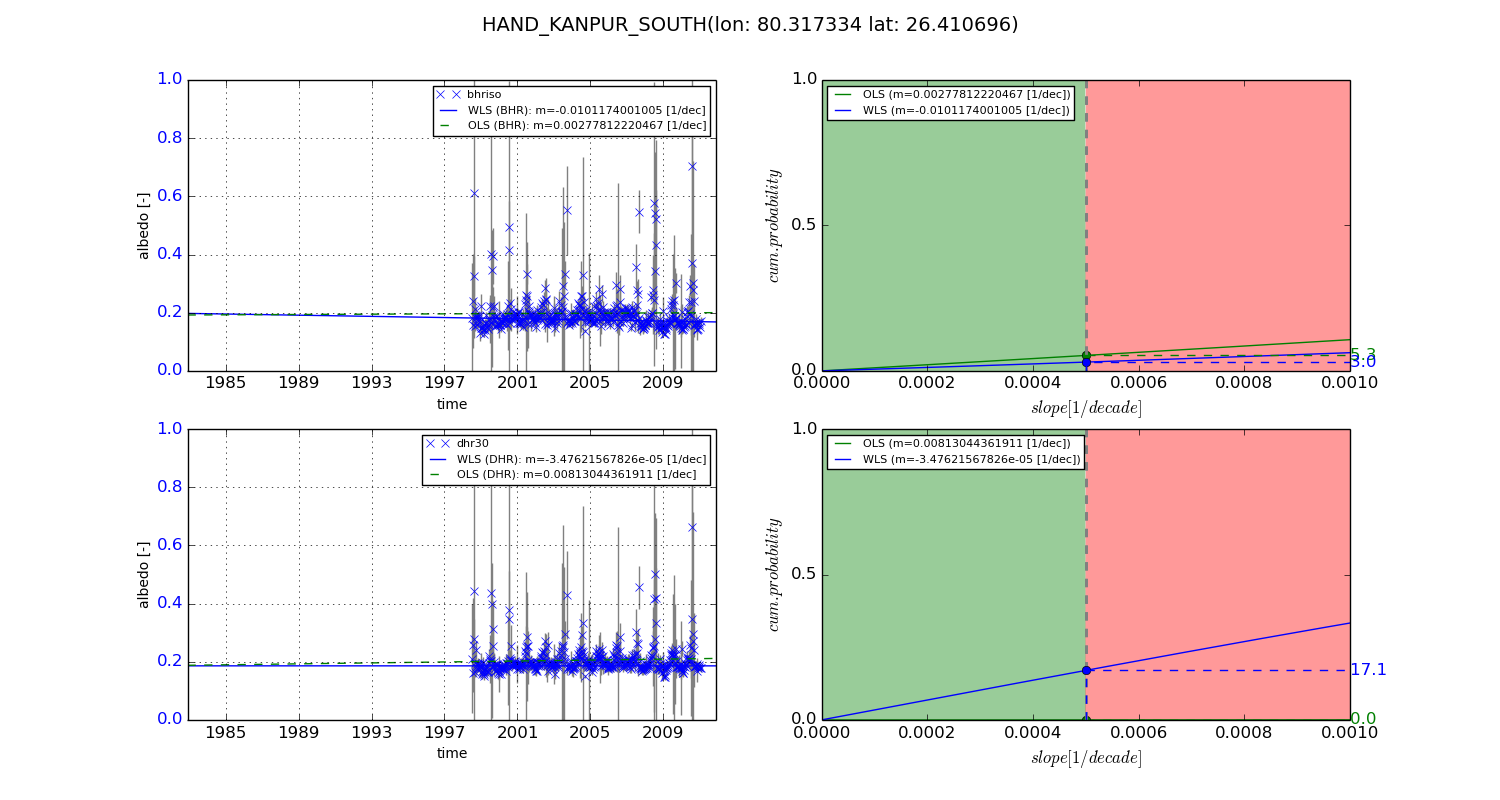
Temporal stability analysis

+000 deg (BHR)


BHR statistics

Temporal stability [1/decade]:


abs

rel


Weighted least square:

None


Ordinary least square:

None


Probabilities that GCOS criteria is met:

Weighted least square:

None %

Ordinary least square:

None %


DHR statistics

Temporal stability [1/decade]:


abs

rel


Weighted least square:

None


Ordinary least square:

None


Probabilities that GCOS criteria is met:

Weighted least square:

None %

Ordinary least square:

None %


+057/+063 deg (BHR)


BHR statistics

Temporal stability [1/decade]:


abs

rel


Weighted least square:

-0.0101174001005


Ordinary least square:

0.00277812220467


Probabilities that GCOS criteria is met:

Weighted least square:

3.0 %

Ordinary least square:

5.3 %


DHR statistics

Temporal stability [1/decade]:


abs

rel


Weighted least square:

-3.47621567826e-05


Ordinary least square:

0.00813044361911


Probabilities that GCOS criteria is met:

Weighted least square:

17.1 %

Ordinary least square:

0.0 %


Temporal anomaly analyis

The variance of the temporal anomalies provides an additional measure about the stability of the signal AFTER removal of the mean seasonal cylce.

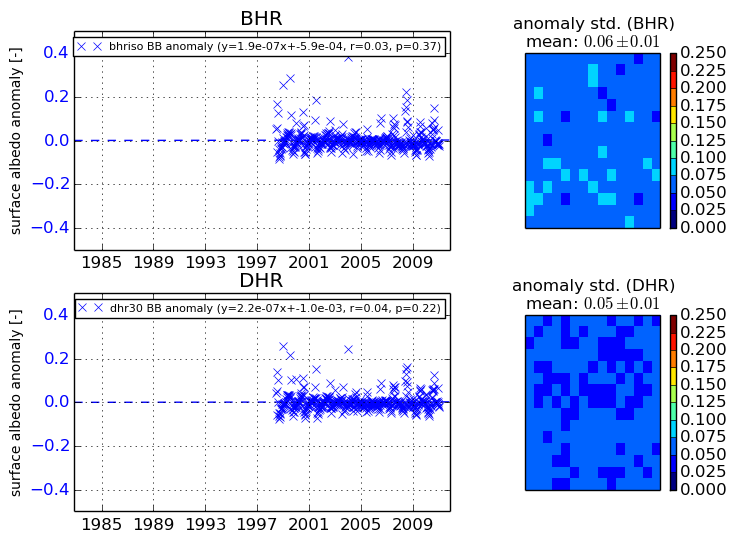
+000 deg


+057/+063 deg