HAND_N_62308


Location

lon / lat [deg]: 80.4727 / 26.534

Source network: AERONET


Geostationary surface albedo (GSA) data


“+000”


“+057/+063”


Landcover information (based on ESA CCI landcover data)


Landcover fractions @ 2km distance


Landcover fractions @ 20 km distance


Legend


Distance to open water bodies [km]:

5.19

Distance to urban areas [km]:

0.12


Radius: 1 km

Number of landcover classes:

5

Dominant landcover type:

190: urban areas

Fraction of dominant landcover type [%]:

53.0


Radius: 2 km

Number of landcover classes:

5

Dominant landcover type:

20: cropland, irrigated or post-flooded

Fraction of dominant landcover type [%]:

55.0


Radius: 5 km

Number of landcover classes:

3

Dominant landcover type:

20: cropland, irrigated or post-flooded

Fraction of dominant landcover type [%]:

77.0


Radius: 10 km

Number of landcover classes:

3

Dominant landcover type:

20: cropland, irrigated or post-flooded

Fraction of dominant landcover type [%]:

86.0


Radius: 20 km

Number of landcover classes:

3

Dominant landcover type:

20: cropland, irrigated or post-flooded

Fraction of dominant landcover type [%]:

74.0


Disturbances


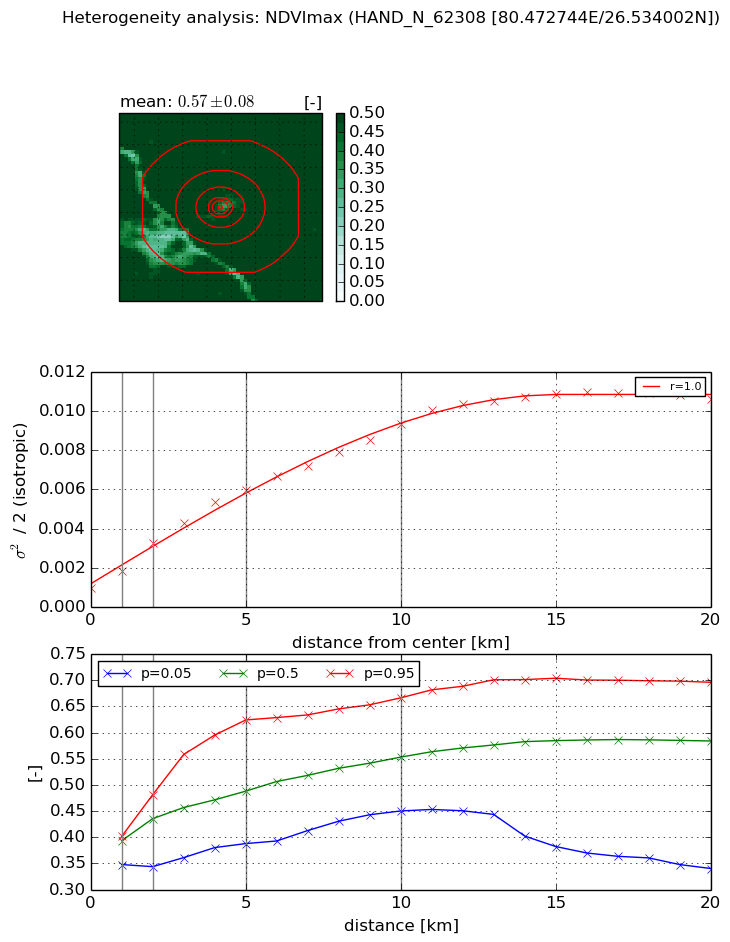
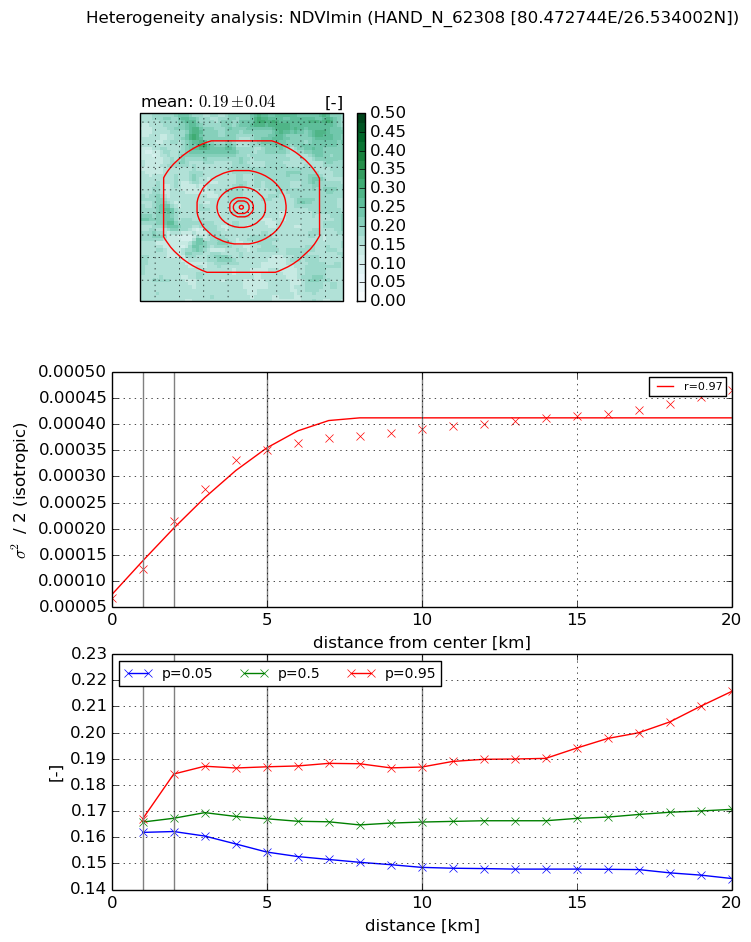
Heterogeneity analysis

The heterogeneity analysis provides information about the spatial and temporal heterogeneity of the site.

Topography


Roman et al. (2009) index


St

9.54349823181

Rcv

0.141274921938

Rse

0.0

Rst

0.167688254234

Rsv

0.00538696327692


Height range @ 1km [m]

6

Height range @ 2km [m]

7

Height range @ 5km [m]

8

Height range @ 10km [m]

-999

Height range @ 20km [m]

-999


Variance slope @ 1 km

3

Variance slope @ 2 km

2

Variance slope @ 5 km

1

Variance slope @ 10 km

-999

Variance slope @ 20 km

-999


NDVI (max. NDVI composite)


Roman et al. (2009) index


St

1.76320905335

Rcv

0.0643298181395

Rse

0.0

Rst

-0.419605879737

Rsv

1.21750747149


NDVI range @ 1km [-]

0.05

NDVI range @ 2km [-]

0.14

NDVI range @ 5km [-]

0.24

NDVI range @ 10km [-]

0.22

NDVI range @ 20km [-]

0.36


Variance slope @ 1 km

0.000847328922679

Variance slope @ 2 km

0.00115645853746

Variance slope @ 5 km

0.00104827444407

Variance slope @ 10 km

0.000817043012265

Variance slope @ 20 km

0.000488015538146


NDVI (min. NDVI composite)I


Roman et al. (2009) index


St

1.52380582276

Rcv

0.172780511533

Rse

0.0

Rst

-0.248995440566

Rsv

1.54697882964


NDVI range @ 1km [-]

0.01

NDVI range @ 2km [-]

0.02

NDVI range @ 5km [-]

0.03

NDVI range @ 10km [-]

0.04

NDVI range @ 20km [-]

0.07


NDVI slope @ 1 km

5.55352599845e-05

NDVI slope @ 2 km

7.41029101069e-05

NDVI slope @ 5 km

6.01252195628e-05

NDVI slope @ 10 km

3.06673444599e-05

NDVI slope @ 20 km

1.43113635901e-05


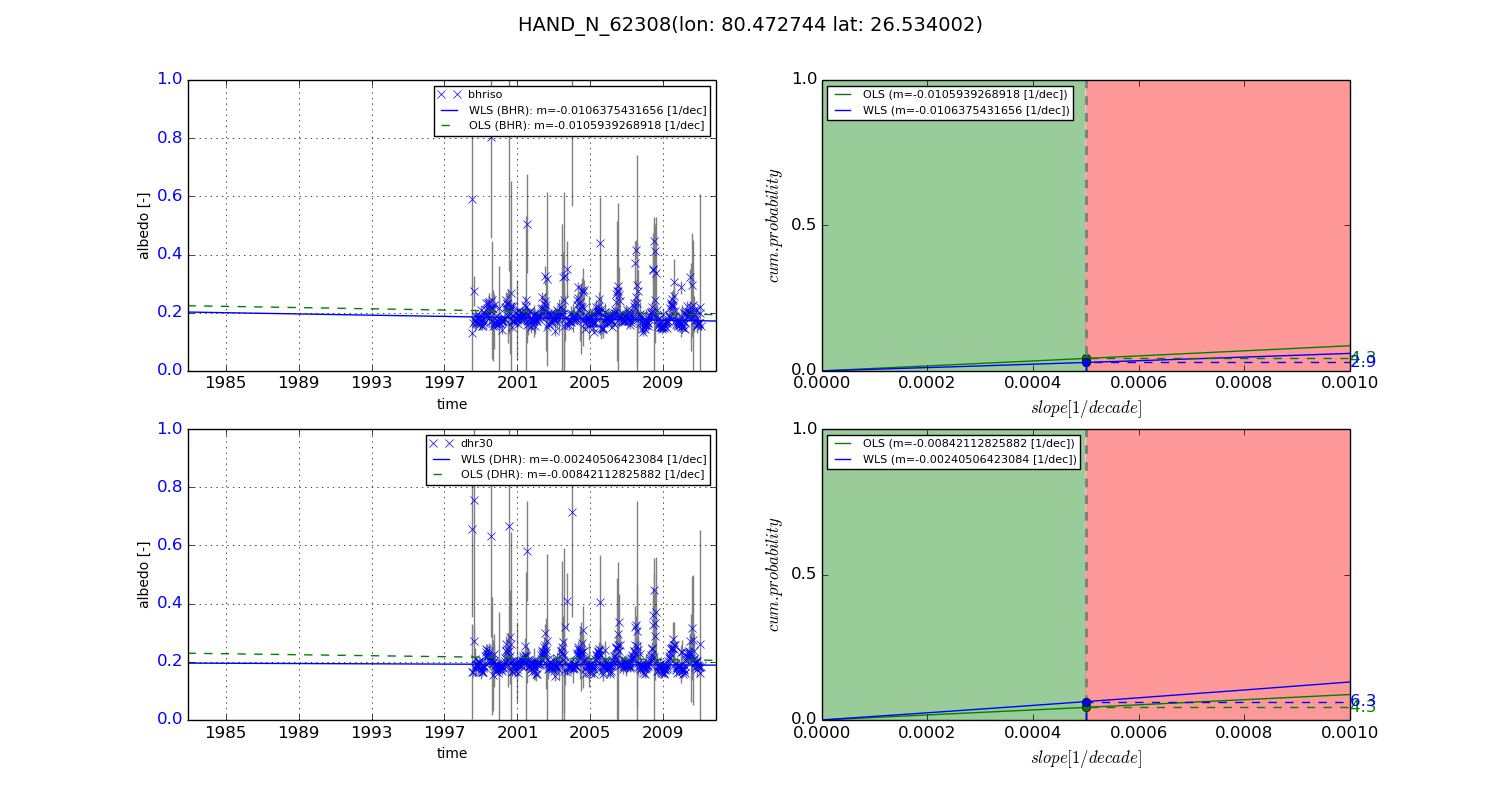
Temporal stability analysis

+000 deg (BHR)


BHR statistics

Temporal stability [1/decade]:


abs

rel


Weighted least square:

None


Ordinary least square:

None


Probabilities that GCOS criteria is met:

Weighted least square:

None %

Ordinary least square:

None %


DHR statistics

Temporal stability [1/decade]:


abs

rel


Weighted least square:

None


Ordinary least square:

None


Probabilities that GCOS criteria is met:

Weighted least square:

None %

Ordinary least square:

None %


+057/+063 deg (BHR)


BHR statistics

Temporal stability [1/decade]:


abs

rel


Weighted least square:

-0.0106375431656


Ordinary least square:

-0.0105939268918


Probabilities that GCOS criteria is met:

Weighted least square:

2.9 %

Ordinary least square:

4.3 %


DHR statistics

Temporal stability [1/decade]:


abs

rel


Weighted least square:

-0.00240506423084


Ordinary least square:

-0.00842112825882


Probabilities that GCOS criteria is met:

Weighted least square:

6.3 %

Ordinary least square:

4.3 %


Temporal anomaly analyis

The variance of the temporal anomalies provides an additional measure about the stability of the signal AFTER removal of the mean seasonal cylce.

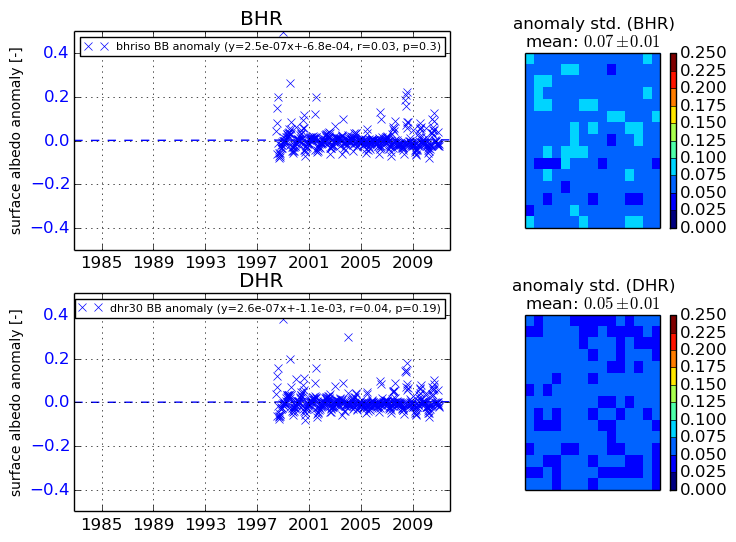
+000 deg


+057/+063 deg