HAND_S_50608


Location

lon / lat [deg]: 80.4927 / 26.2856

Source network: AERONET


Geostationary surface albedo (GSA) data


“+000”


“+057/+063”


Landcover information (based on ESA CCI landcover data)


Landcover fractions @ 2km distance


Landcover fractions @ 20 km distance


Legend


Distance to open water bodies [km]:

5.47

Distance to urban areas [km]:

0.6


Radius: 1 km

Number of landcover classes:

2

Dominant landcover type:

20: cropland, irrigated or post-flooded

Fraction of dominant landcover type [%]:

94.0


Radius: 2 km

Number of landcover classes:

2

Dominant landcover type:

20: cropland, irrigated or post-flooded

Fraction of dominant landcover type [%]:

96.0


Radius: 5 km

Number of landcover classes:

1

Dominant landcover type:

20: cropland, irrigated or post-flooded

Fraction of dominant landcover type [%]:

99.0


Radius: 10 km

Number of landcover classes:

3

Dominant landcover type:

20: cropland, irrigated or post-flooded

Fraction of dominant landcover type [%]:

82.0


Radius: 20 km

Number of landcover classes:

3

Dominant landcover type:

20: cropland, irrigated or post-flooded

Fraction of dominant landcover type [%]:

80.0


Disturbances


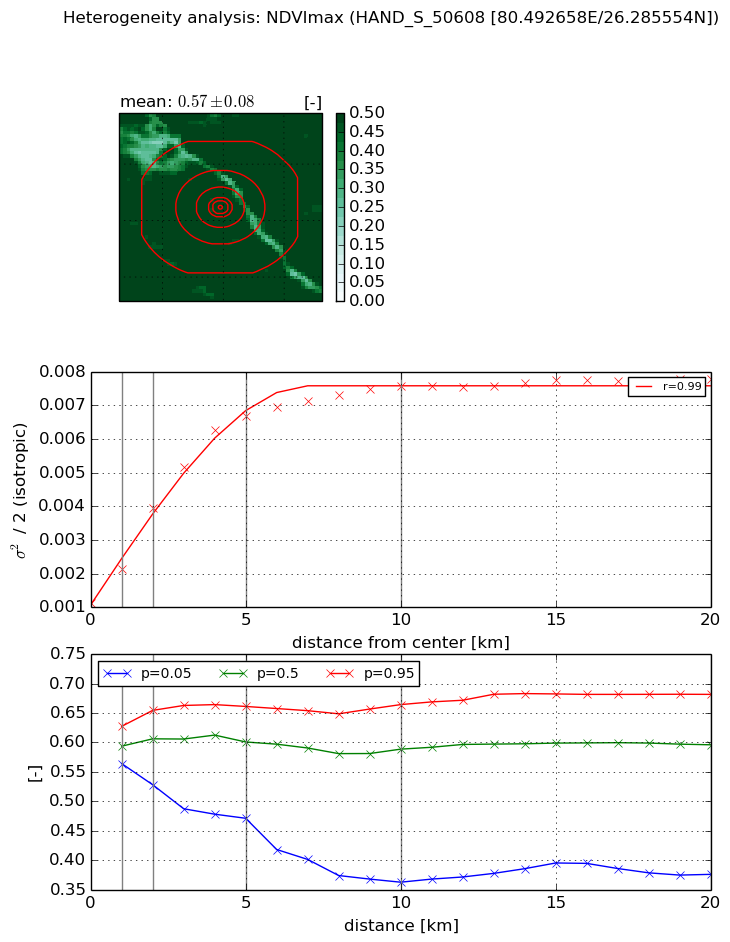
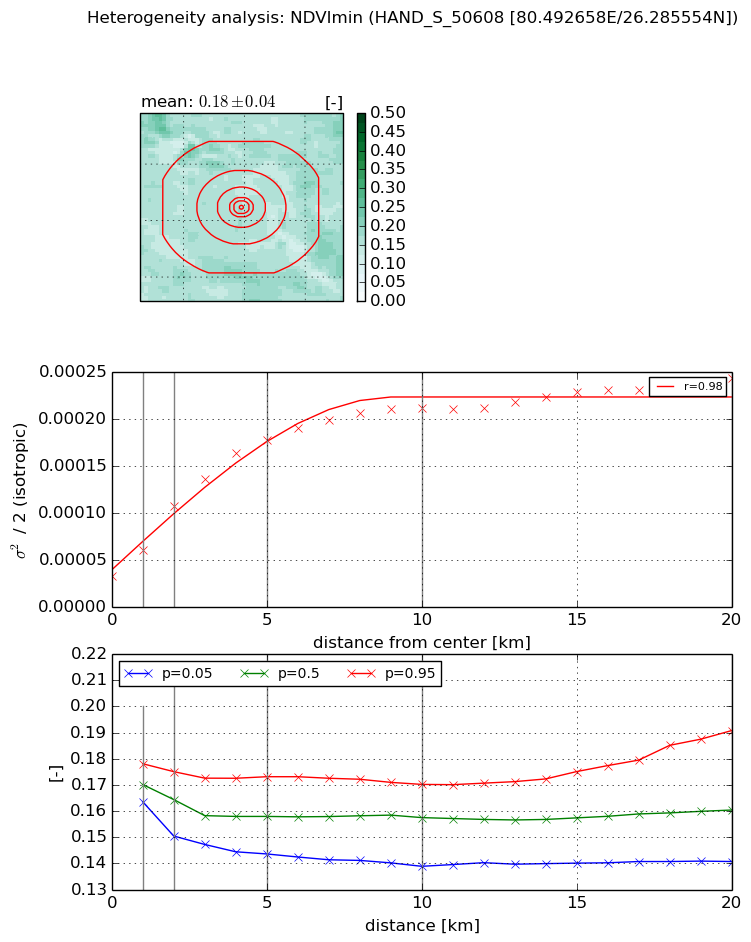
Heterogeneity analysis

The heterogeneity analysis provides information about the spatial and temporal heterogeneity of the site.

Topography


Roman et al. (2009) index


St

1.95825714967e-05

Rcv

0.227981459039

Rse

0.0

Rst

-0.0649496270516

Rsv

153197.156163


Height range @ 1km [m]

4

Height range @ 2km [m]

5

Height range @ 5km [m]

7

Height range @ 10km [m]

-999

Height range @ 20km [m]

-999


Variance slope @ 1 km

2

Variance slope @ 2 km

1

Variance slope @ 5 km

1

Variance slope @ 10 km

-999

Variance slope @ 20 km

-999


NDVI (max. NDVI composite)


Roman et al. (2009) index


St

9.59825558017

Rcv

0.0884179638049

Rse

0.0

Rst

0.0475943614579

Rsv

-0.176544469557


NDVI range @ 1km [-]

0.06

NDVI range @ 2km [-]

0.13

NDVI range @ 5km [-]

0.19

NDVI range @ 10km [-]

0.3

NDVI range @ 20km [-]

0.31


Variance slope @ 1 km

0.00101333613349

Variance slope @ 2 km

0.00141656969697

Variance slope @ 5 km

0.00118433161702

Variance slope @ 10 km

0.000623343604834

Variance slope @ 20 km

0.000239812430425


NDVI (min. NDVI composite)I


Roman et al. (2009) index


St

1.08159383652

Rcv

0.0526665601623

Rse

0.0

Rst

-0.521158404558

Rsv

2.19985948012


NDVI range @ 1km [-]

0.01

NDVI range @ 2km [-]

0.02

NDVI range @ 5km [-]

0.03

NDVI range @ 10km [-]

0.03

NDVI range @ 20km [-]

0.05


NDVI slope @ 1 km

2.76145556391e-05

NDVI slope @ 2 km

3.70316154833e-05

NDVI slope @ 5 km

3.02681459959e-05

NDVI slope @ 10 km

1.76088598501e-05

NDVI slope @ 20 km

8.09755547825e-06


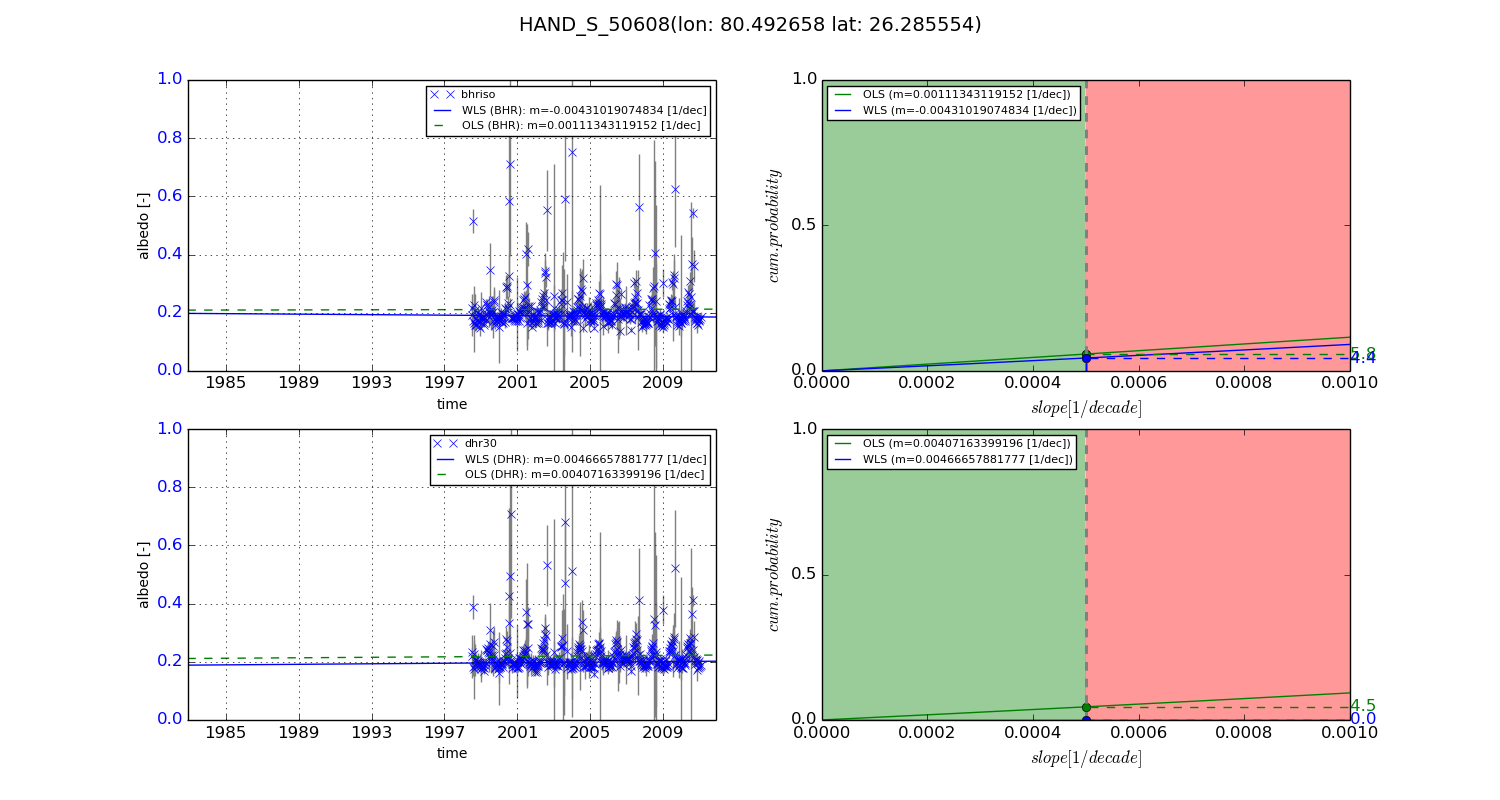
Temporal stability analysis

+000 deg (BHR)


BHR statistics

Temporal stability [1/decade]:


abs

rel


Weighted least square:

None


Ordinary least square:

None


Probabilities that GCOS criteria is met:

Weighted least square:

None %

Ordinary least square:

None %


DHR statistics

Temporal stability [1/decade]:


abs

rel


Weighted least square:

None


Ordinary least square:

None


Probabilities that GCOS criteria is met:

Weighted least square:

None %

Ordinary least square:

None %


+057/+063 deg (BHR)


BHR statistics

Temporal stability [1/decade]:


abs

rel


Weighted least square:

-0.00431019074834


Ordinary least square:

0.00111343119152


Probabilities that GCOS criteria is met:

Weighted least square:

4.4 %

Ordinary least square:

5.8 %


DHR statistics

Temporal stability [1/decade]:


abs

rel


Weighted least square:

0.00466657881777


Ordinary least square:

0.00407163399196


Probabilities that GCOS criteria is met:

Weighted least square:

0.0 %

Ordinary least square:

4.5 %


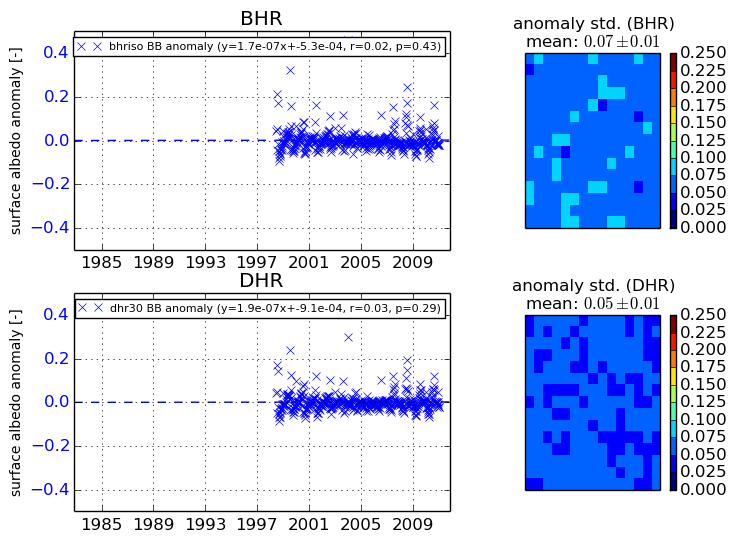
Temporal anomaly analyis

The variance of the temporal anomalies provides an additional measure about the stability of the signal AFTER removal of the mean seasonal cylce.

+000 deg


+057/+063 deg


By continuing to use this website, you are giving consent to analytic cookies being used. For more information on how EUMETSAT uses data and how you can disable this, please view this web page: Analytics Cookie Policy